

Question: The required input values for use in forecasting values is provided at the top of the Excel file. Be sure to reference cells and show
The required input values for use in forecasting values is provided at the top of the Excel file. Be sure to reference cells and show all calculations and not simply type values into the yellow boxes. Note that all values are in millions of dollars.
Part A: Sales Revenues
Assume that net sales in 2021 equal to $5,000 for MicroDrive. Forecast the net sales in years 2022 to 2028 using the growth rates provided. Use the Excel FV function to calculate the net sales. For example, type "=FV(Growth rate cell reference, 1,0,-Net sales cell reference)".
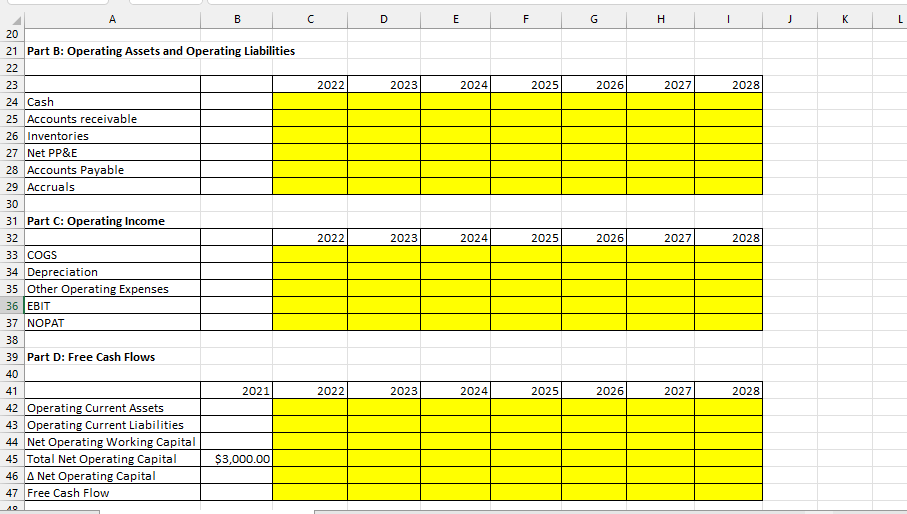
Part B: Operating Assets and Operating Liabilities
Fill in the table for operating assets and operating liabilities by referencing the required ratio and net sales.
Part C: Operating Income
Fill in the table for COGS, Depreciation, and other operating expenses by referencing the required ratios. Calculate the following by referencing cells:
EBIT = Net Sales - COGS - Depreciation - Other Operating Expenses
NOPAT = EBIT * (1-Tax Rate)
Part D: Free Cash Flows
Calculate the following by referencing cells:
Operating Current Assets = Cash + Accounts Receivables + Inventories
Operating Current Liabilities = Accounts Payable + Accruals
Net Operating Working Capital = Operating Current Assets - Operating Current Liabilities
Total Net Operating Capital = Net PP&E + Net Operating Working Capital
? Net Operating Capital = Total Net Operating Capital this year - Total Net Operating Capital last year
Free Cash Flow = NOPAT - ? Net Operating Capital
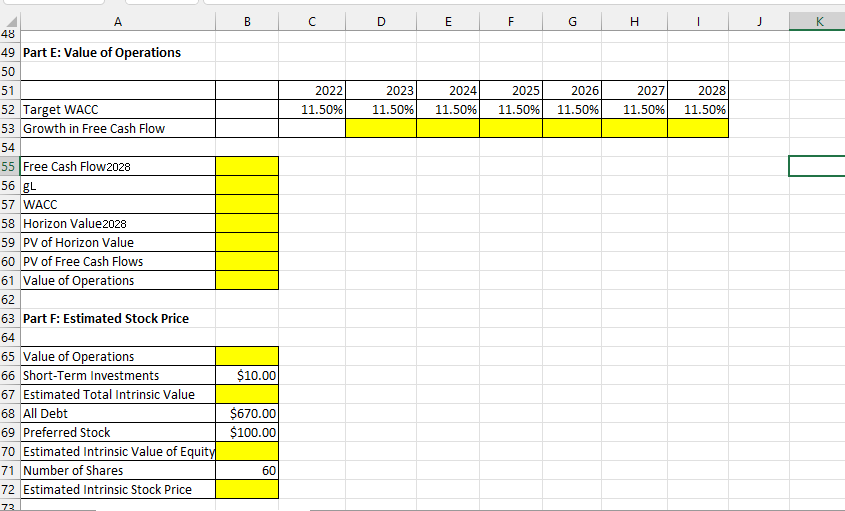
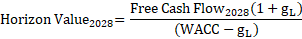
Part E: Value of Operations
Calculate the following by referencing cells:
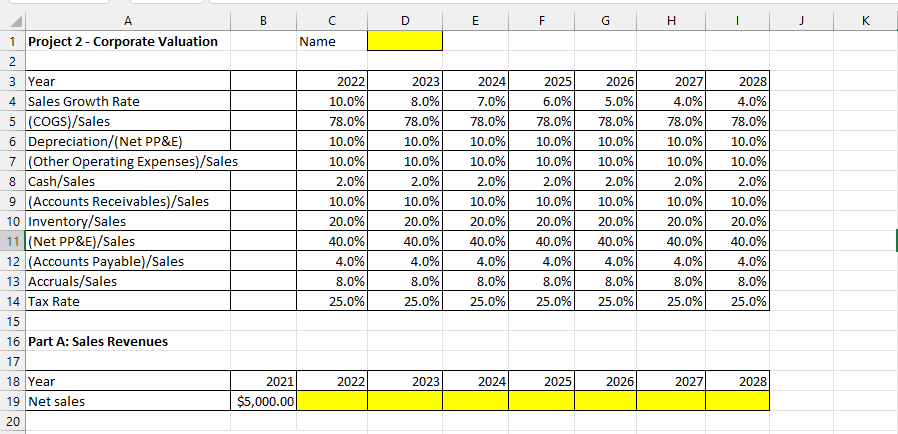

A 1 Project 2 - Corporate Valuation 2 3 Year 4 Sales Growth Rate 5 (COGS)/Sales 6 Depreciation/(Net PP&E) 7 (Other Operating Expenses)/Sales 8 Cash/Sales 9 (Accounts Receivables)/Sales 10 Inventory/Sales 11 (Net PP&E)/Sales 12 (Accounts Payable)/Sales 13 Accruals/Sales 14 Tax Rate 15 16 Part A: Sales Revenues 17 18 Year 19 Net sales 20 B 2021 $5,000.00 Name 2022 10.0% 78.0% 10.0% 10.0% 2.0% 10.0% 20.0% 40.0% 4.0% 8.0% 25.0% 2022 D E 2023 F 2023 2024 2025 2026 8.0% 7.0% 6.0% 5.0% 78.0% 78.0% 78.0% 78.0% 10.0% 10.0% 10.0% 10.0% 10.0% 10.0% 10.0% 10.0% 2.0% 2.0% 2.0% 2.0% 10.0% 10.0% 10.0% 10.0% 20.0% 20.0% 20.0% 20.0% 40.0% 40.0% 40.0% 40.0% 4.0% 4.0% 4.0% 4.0% 8.0% 8.0% 8.0% 8.0% 25.0% 25.0% 25.0% 25.0% 2024 G 2025 2026 H 2027 4.0% 78.0% 78.0% 10.0% 10.0% 10.0% 2.0% 10.0% 10.0% 20.0% 20.0% 40.0% 40.0% 4.0% 4.0% 8.0% 8.0% 25.0% 25.0% 10.0% 2.0% 2028 4.0% 2027 2028 J K
Step by Step Solution
There are 3 Steps involved in it
Here are the calculations for Parts A through D with details ... View full answer

Get step-by-step solutions from verified subject matter experts