

Question: The resource-allocation graph shown below does not always lead to a deadlock, the scheduler plays a role. Assume P, and P, have CPU bursts of
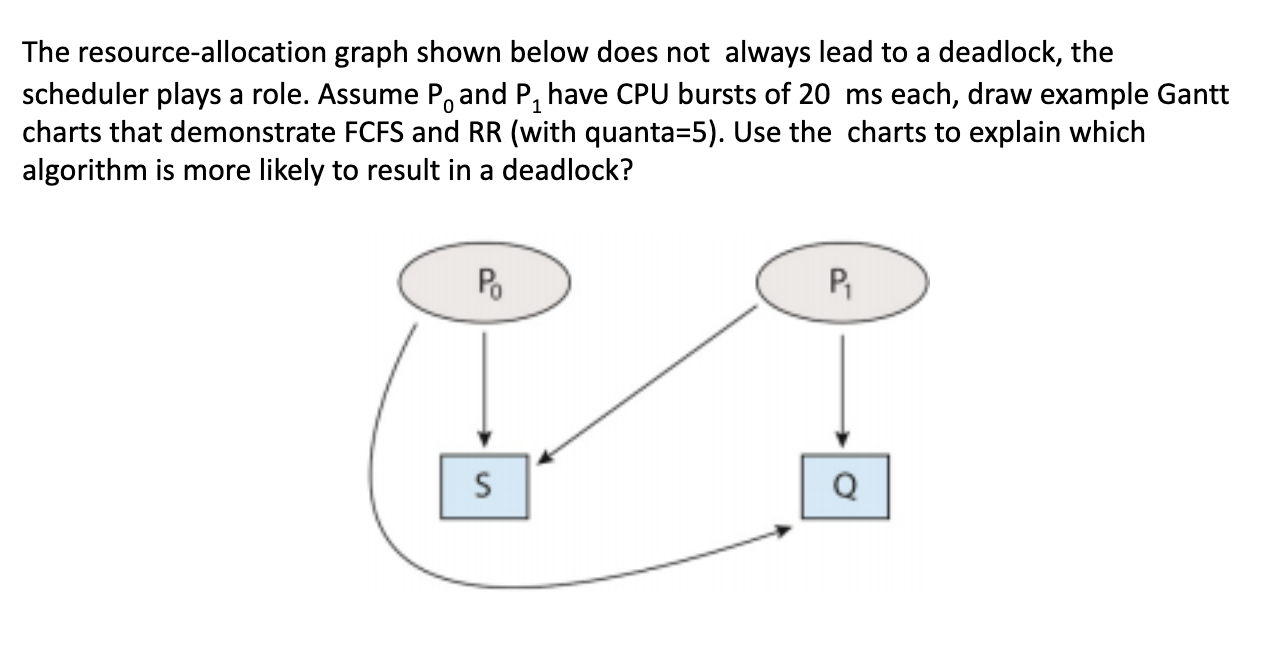
The resource-allocation graph shown below does not always lead to a deadlock, the scheduler plays a role. Assume P, and P, have CPU bursts of 20 ms each, draw example Gantt charts that demonstrate FCFS and RR (with quanta=5). Use the charts to explain which algorithm is more likely to result in a deadlock? P. P S
Step by Step Solution
There are 3 Steps involved in it
1 Expert Approved Answer
Step: 1 Unlock

Question Has Been Solved by an Expert!
Get step-by-step solutions from verified subject matter experts
Step: 2 Unlock
Step: 3 Unlock