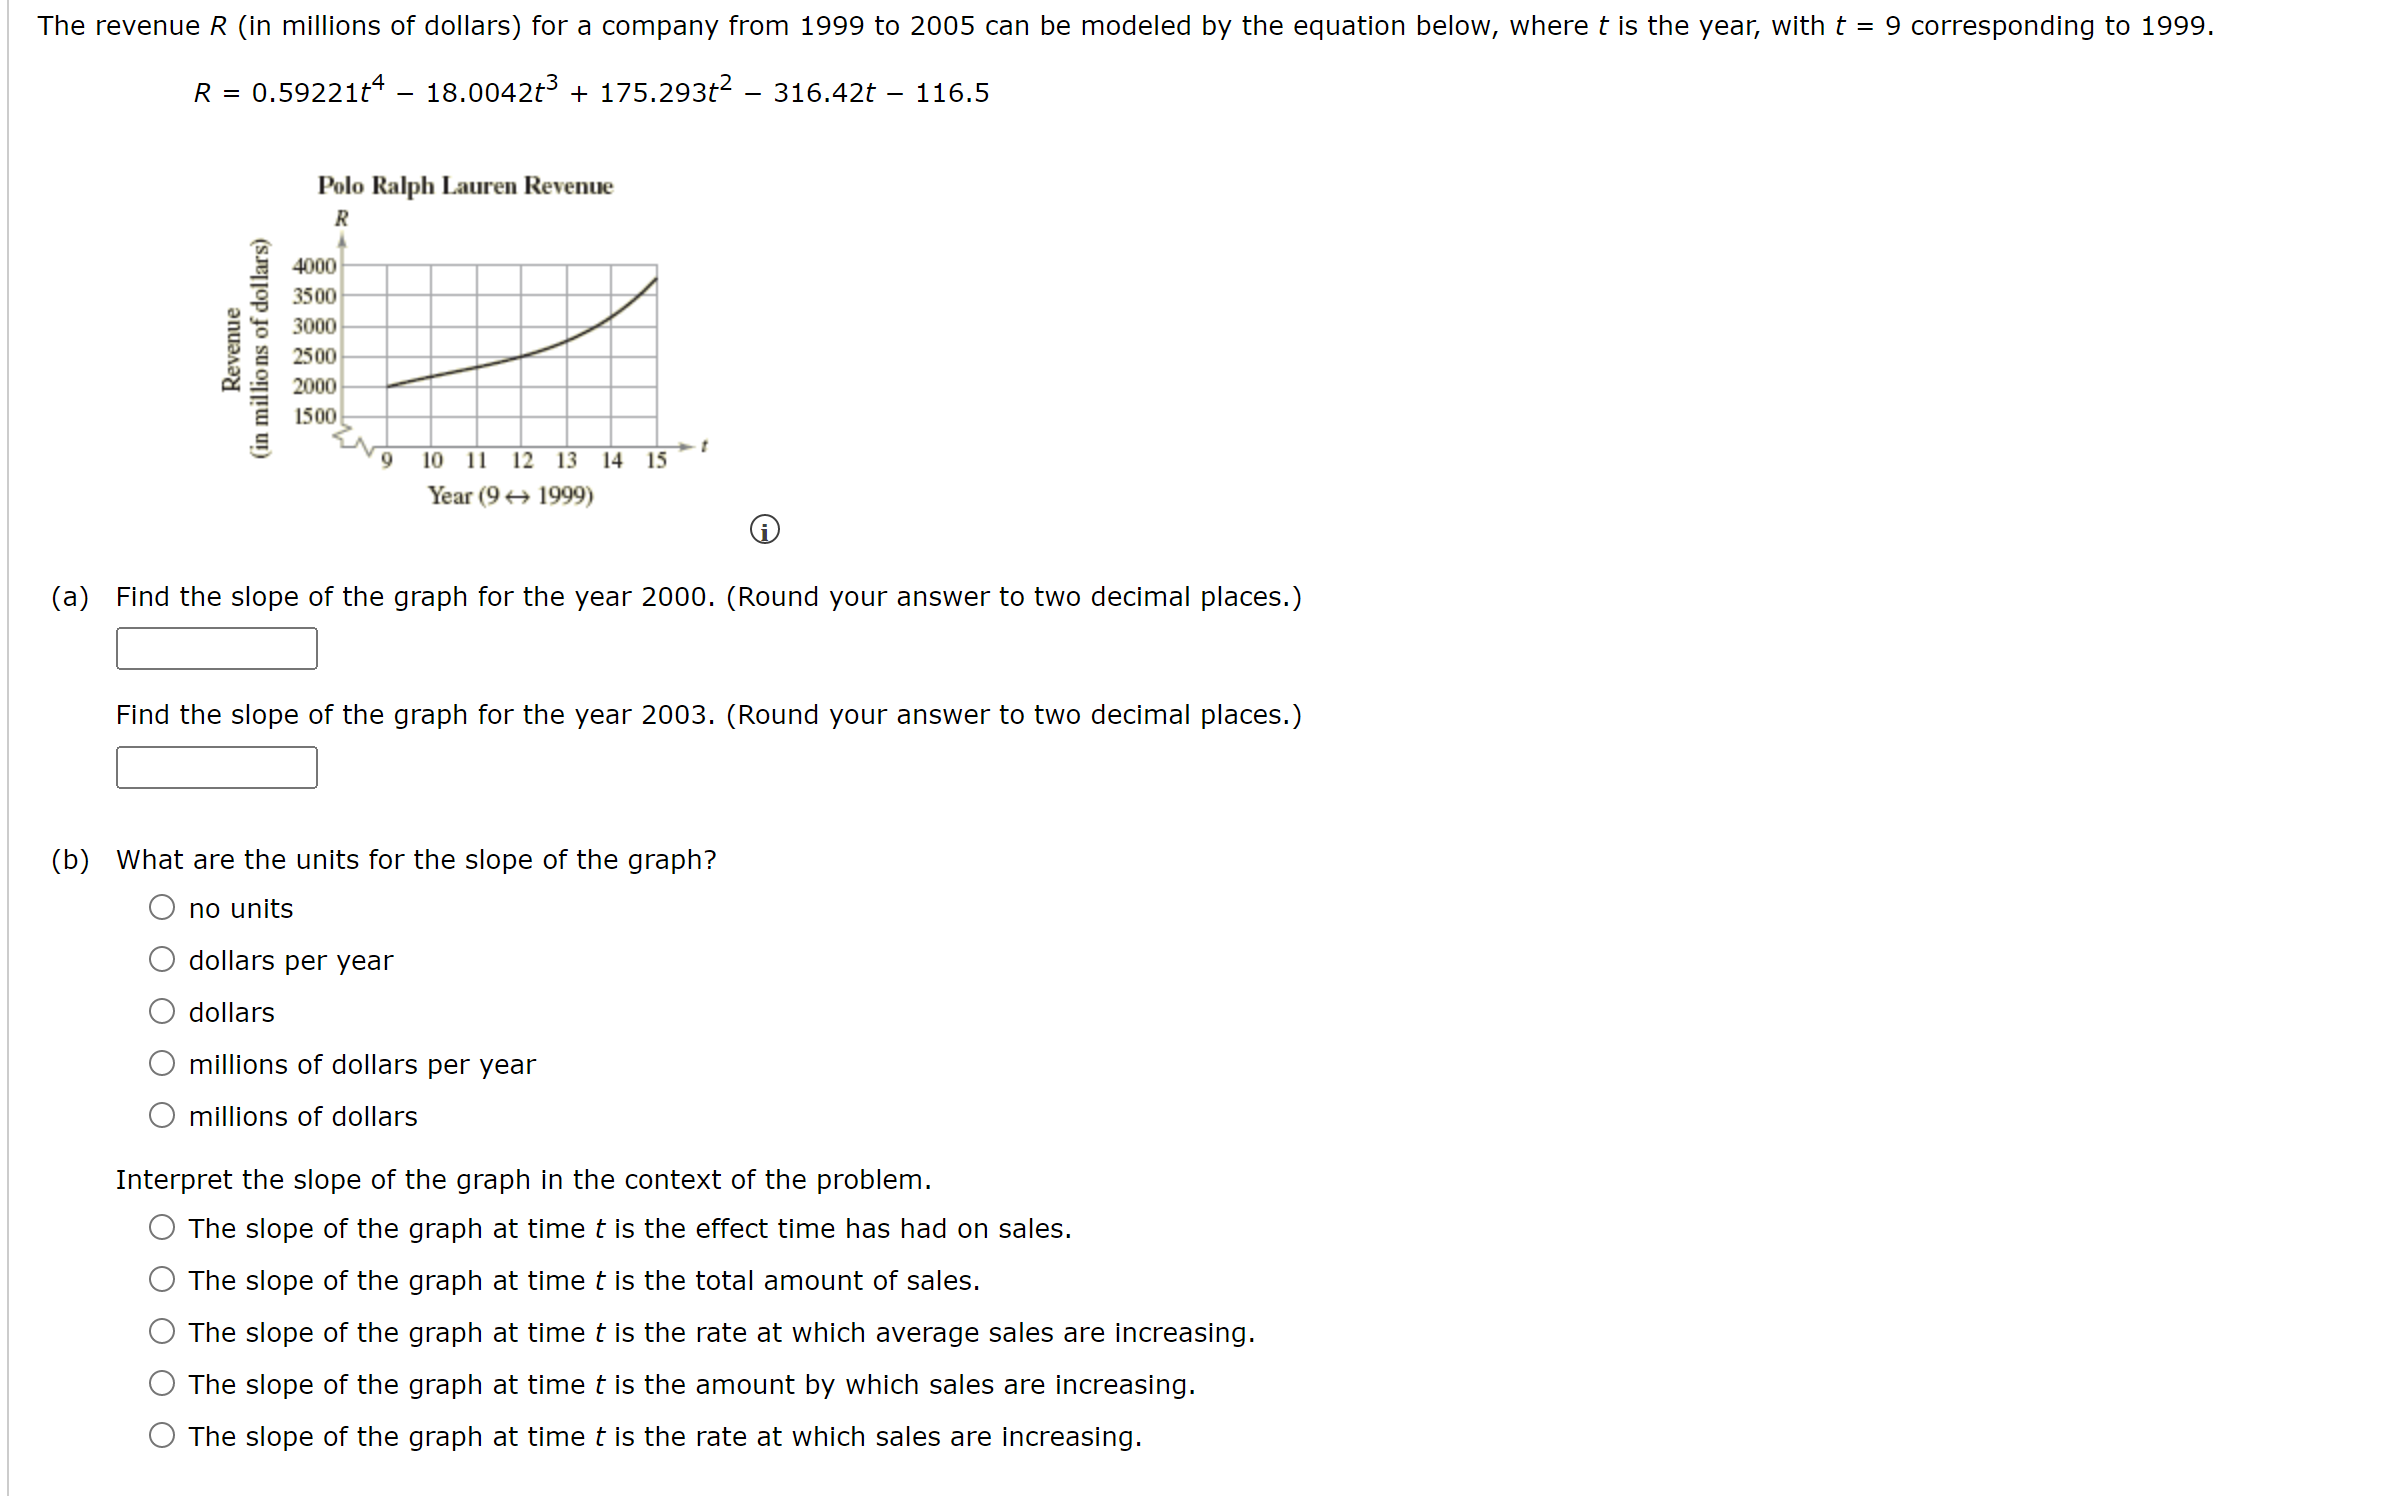
The revenue R (in millions of dollars) for a company from 1999 to 2005 can be...
Fantastic news! We've Found the answer you've been seeking!
Question:
Transcribed Image Text:
The revenue R (in millions of dollars) for a company from 1999 to 2005 can be modeled by the equation below, where t is the year, with t = 9 corresponding to 1999. 0.59221t4 - 18.0042t + 175.293t 316.42t - 116.5 R = Revenue (in millions of dollars) Polo Ralph Lauren Revenue R 4000 3500 3000 2500 2000 1500 9 10 11 12 13 14 15 Year (9 1999) t (a) Find the slope of the graph for the year 2000. (Round your answer to two decimal places.) Find the slope of the graph for the year 2003. (Round your answer to two decimal places.) (b) What are the units for the slope of the graph? no units dollars per year dollars millions of dollars per year millions of dollars Interpret the slope of the graph in the context of the problem. The slope of the graph at time t is the effect time has had on sales. The slope of the graph at time t is the total amount of sales. The slope of the graph at time t is the rate at which average sales are increasing. The slope of the graph at time t is the amount by which sales are increasing. The slope of the graph at time t is the rate at which sales are increasing. The revenue R (in millions of dollars) for a company from 1999 to 2005 can be modeled by the equation below, where t is the year, with t = 9 corresponding to 1999. 0.59221t4 - 18.0042t + 175.293t 316.42t - 116.5 R = Revenue (in millions of dollars) Polo Ralph Lauren Revenue R 4000 3500 3000 2500 2000 1500 9 10 11 12 13 14 15 Year (9 1999) t (a) Find the slope of the graph for the year 2000. (Round your answer to two decimal places.) Find the slope of the graph for the year 2003. (Round your answer to two decimal places.) (b) What are the units for the slope of the graph? no units dollars per year dollars millions of dollars per year millions of dollars Interpret the slope of the graph in the context of the problem. The slope of the graph at time t is the effect time has had on sales. The slope of the graph at time t is the total amount of sales. The slope of the graph at time t is the rate at which average sales are increasing. The slope of the graph at time t is the amount by which sales are increasing. The slope of the graph at time t is the rate at which sales are increasing.
Expert Answer:
Related Book For
Posted Date:
Students also viewed these mathematics questions
-
A researcher wanted to find out if there was difference between older movie goers and younger movie goers with respect to their estimates of a successful actors income. The researcher first...
-
Carol Harris, Ph.D, CPA, is a single taxpayer and she lives at 674 Yankee Street, Durham, NC 27409. Her Social Security number is 793-52-4335. Carol is an Associate Professor of Accounting at a local...
-
Express the given quantity in terms of sin x and cos x. sin 2 X
-
Adult Americans (18 years or older) were asked whether they used social media (Facebook, Twitter, and so on) regularly. The following table is based on the results of the survey. (a) What is the...
-
You are a manager, and a member of one of your task groups comes to you and says that his group is engaging in groupthink and he is being pressured to conform to their rules. You cant disclose this...
-
Suppose you make 15 equal annual deposits of \($1,000\) each into a bank account paying 5% interest per year. The first deposit will be made one year from today. How much money can be withdrawn from...
-
An importer of childrens toys, Fun N Games, Inc., receives a price quotation from a German toy maker offering toy train sets: KBG train sets. Locomotive. Four cars. Transformers. Thirty pieces of...
-
How does Lean Management foster a culture of continuous improvement and waste reduction within organizational processes ? Explain
-
List 5 business events that would require you to recruit new staff What is the primary factor in determining staffing needs List 3 pieces of information you may need to supply to management when...
-
identify some of the risk that firms face and explain on the strategies that they use to mitigate the risks as part of their risk management effort. Use Kontiki Finance (Finance company in Fiji) and...
-
The cash flows associated with a project can be represented by the following decision tree (conditional probabilities are in parentheses): Year 0 $800 Year 1 Year 2 Year 3 $200 (5) $200 (5) $400 (5)...
-
Spotify trades at a huge valuation despite losing money. What is the market assuming about is future? What are investors betting on to justify such a large valuation?
-
3. Create a spreadsheet modeling trajectories of geometric Brownian motion starting at 100 with a growth rate of 5 percent, which is also a risk-free rate, and volatility of 30 percent. Make a...
-
How does financial organization work? sole proprietorship, partnerships and corporation?
-
Given the following code for binary search, binarySearch () and the content of the list below, fill Table 1 below with the values of first, last, mid and list[mid] when calling the function...
-
Calculate I, , and a for a 0.0175 m solution of Na 3 PO 4 at 298 K. Assume complete dissociation. How confident are you that your calculated results will agree with experimental results?
-
The sine function is an odd function, so sin(-2x) = -2 sin x cos x.
-
The initial and terminal points of a vector are given. Write the vector as a linear combination of the standard unit vectors i and j. Initial Point...
-
If possible, find (a) AB (b) BA (c) A2. 1. 2. 27 2] 2 -1 B = -1 || 6 3 -2 0 B = -2 -4 4 2 4
-
Identify and explain the meaning of the term "strategy."
-
Identify and describe the major features of the Strategic Management model.
-
Identify and describe the relationship between the strategy formulation process and the strategy implementation process.
Handbook Of Coaching Psychology A Guide For Practitioners 2nd Edition - ISBN: 1138775320 - Free Book
Study smarter with the SolutionInn App