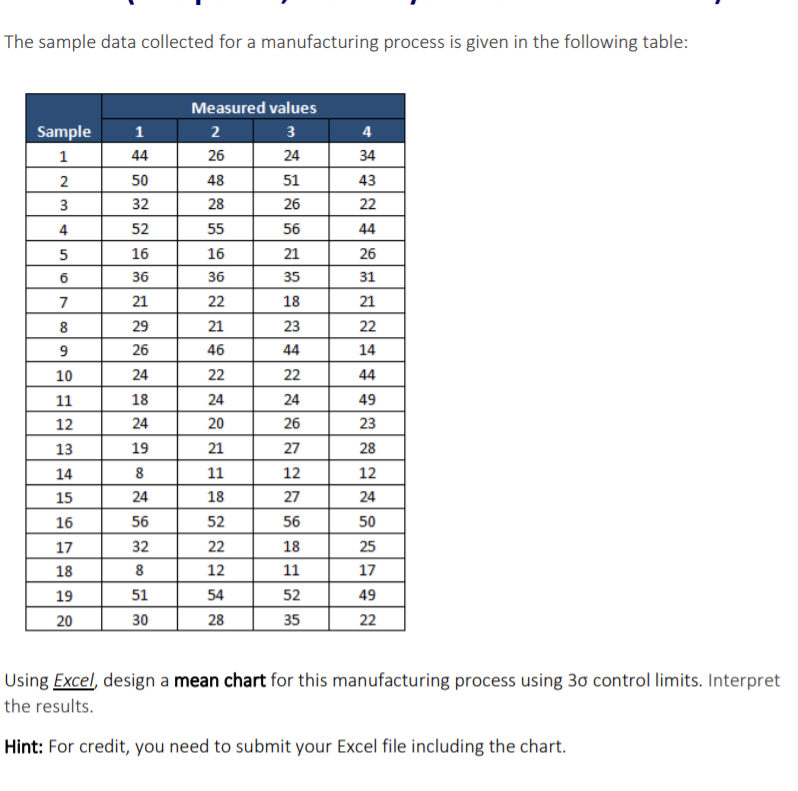
Question: The sample data collected for a manufacturing process is given in the following table: 4 Sample 1 2 1 44 50 32 Measured values 2

The sample data collected for a manufacturing

The sample data collected for a manufacturing process is given in the following table: 4 Sample 1 2 1 44 50 32 Measured values 2 3 26 24 48 51 28 55 56 16 21 36 35 3 26 34 43 22 44 26 31 52 4 5 16 36 6 7 21 22 18 21 23 22 8 9 10 44 22 24 26 11 21 46 22 24 20 21 11 18 14 44 49 23 28 12 27 29 26 24 18 24 19 8 24 56 32 8 51 30 12 13 14 15 12 27 24 16 52 17 18 19 22 12 56 18 11 52 35 50 25 17 49 22 54 28 Using Excel, design a mean chart for this manufacturing process using 30 control limits. Interpret the results. Hint: For credit, you need to submit your Excel file including the chart

Step by Step Solution

There are 3 Steps involved in it

1 Expert Approved Answer
Step: 1 Unlock blur-text-image
Question Has Been Solved by an Expert!

Get step-by-step solutions from verified subject matter experts

Step: 2 Unlock
Step: 3 Unlock

Students Have Also Explored These Related General Management Questions!