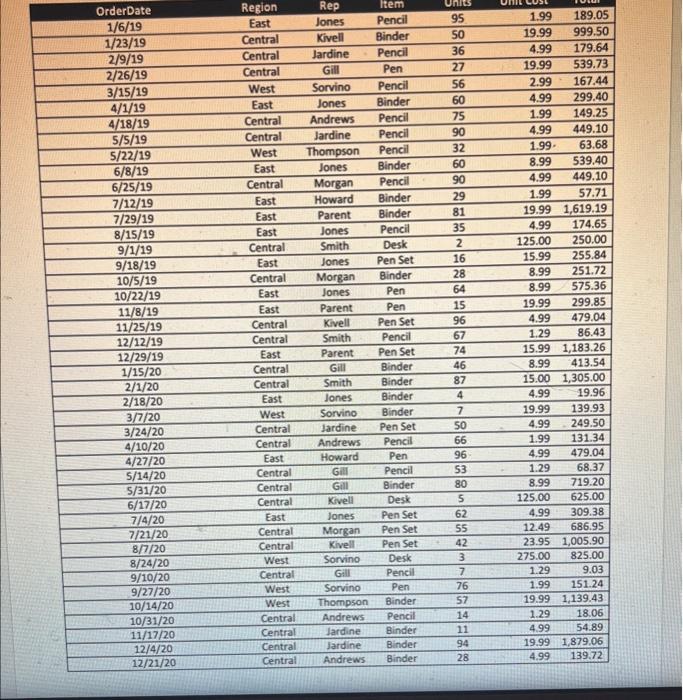
Question: The sample data on this page is sales data for an imaginary office supply company, and each row represents one order. Each row shows: -

The sample data on this page is sales data for an
The sample data on this page is sales data for an imaginary office supply company, and each row represents one order. Each row shows: - OrderDate: when the order was placed, - Region: geographical area in which the sale was made - Rep: sales representative's name - Item: name of the item sold - Units: number of units sold - UnitCost: cost of one unit - Total: total cost of the order - Units x UnitCost Now, please answer the following questions: 1. What is the average unit cost of all orders? ( 1.25 points) 2. How many units are sold in total? ( 1.25 points) 3. What is the maximum value for the number of sold units? (tip: you can either use sorting feature or "max0" function) ( 1.25 points) 4. How many of the orders are placed in the Central region? ( 1.25 points) 5. (optional) What is the difference between the total sold units of pencil and pen? ( 0.5 Extra points)

Step by Step Solution

There are 3 Steps involved in it

1 Expert Approved Answer
Step: 1 Unlock blur-text-image
Question Has Been Solved by an Expert!

Get step-by-step solutions from verified subject matter experts

Step: 2 Unlock
Step: 3 Unlock

Students Have Also Explored These Related General Management Questions!