

Question: The sample graph depicts the difference in concentrations of PM 2.5 particulate matter* before, during, and after the pandemic shutdowns at environmental monitoring stations in
The sample graph depicts the difference in concentrations of PM 2.5 particulate matter* before, during, and after the pandemic shutdowns at environmental monitoring stations in residential areas of a city. With what kind of instrument is this analysis carried out that allows the collection of continuous data to make comparisons with ambient air quality standards?
A.Optical Particle Counter B. Particle Photometer C. Condensed Particle Counter
D. Sampling pump with impactor
D 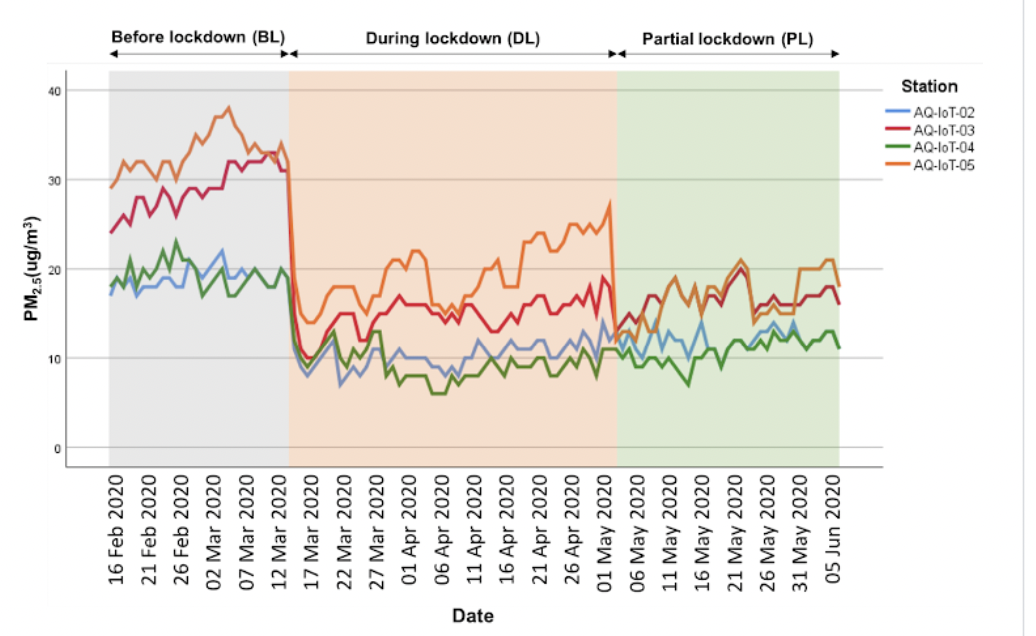 r
r
Step by Step Solution
There are 3 Steps involved in it
1 Expert Approved Answer
Step: 1 Unlock

Question Has Been Solved by an Expert!
Get step-by-step solutions from verified subject matter experts
Step: 2 Unlock
Step: 3 Unlock