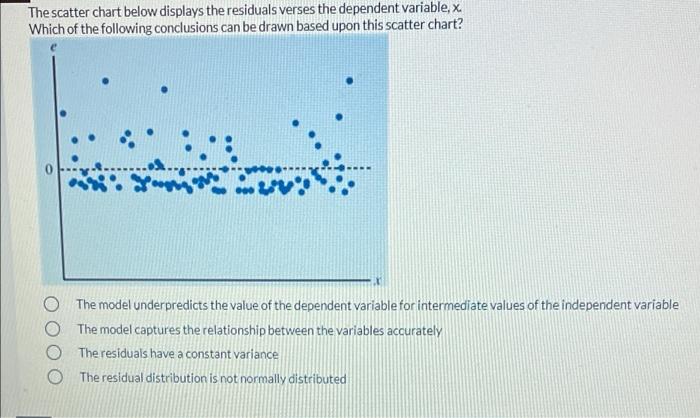
Question: The scatter chart below displays the residuals verses the dependent variable, X. Which of the following conclusions can be drawn based upon this scatter chart?

The scatter chart below displays the residuals
The scatter chart below displays the residuals verses the dependent variable, X. Which of the following conclusions can be drawn based upon this scatter chart? O The model underpredicts the value of the dependent variable for intermediate values of the independent variable O The model captures the relationship between the variables accurately The residuals have a constant variance O The residual distribution is not normally distributed

Step by Step Solution

There are 3 Steps involved in it

1 Expert Approved Answer
Step: 1 Unlock blur-text-image
Question Has Been Solved by an Expert!

Get step-by-step solutions from verified subject matter experts

Step: 2 Unlock
Step: 3 Unlock

Students Have Also Explored These Related General Management Questions!