

Question: The scatter plot and trend line shown at left plot the relationship between how early students turned in an exam (measured by minutes left in
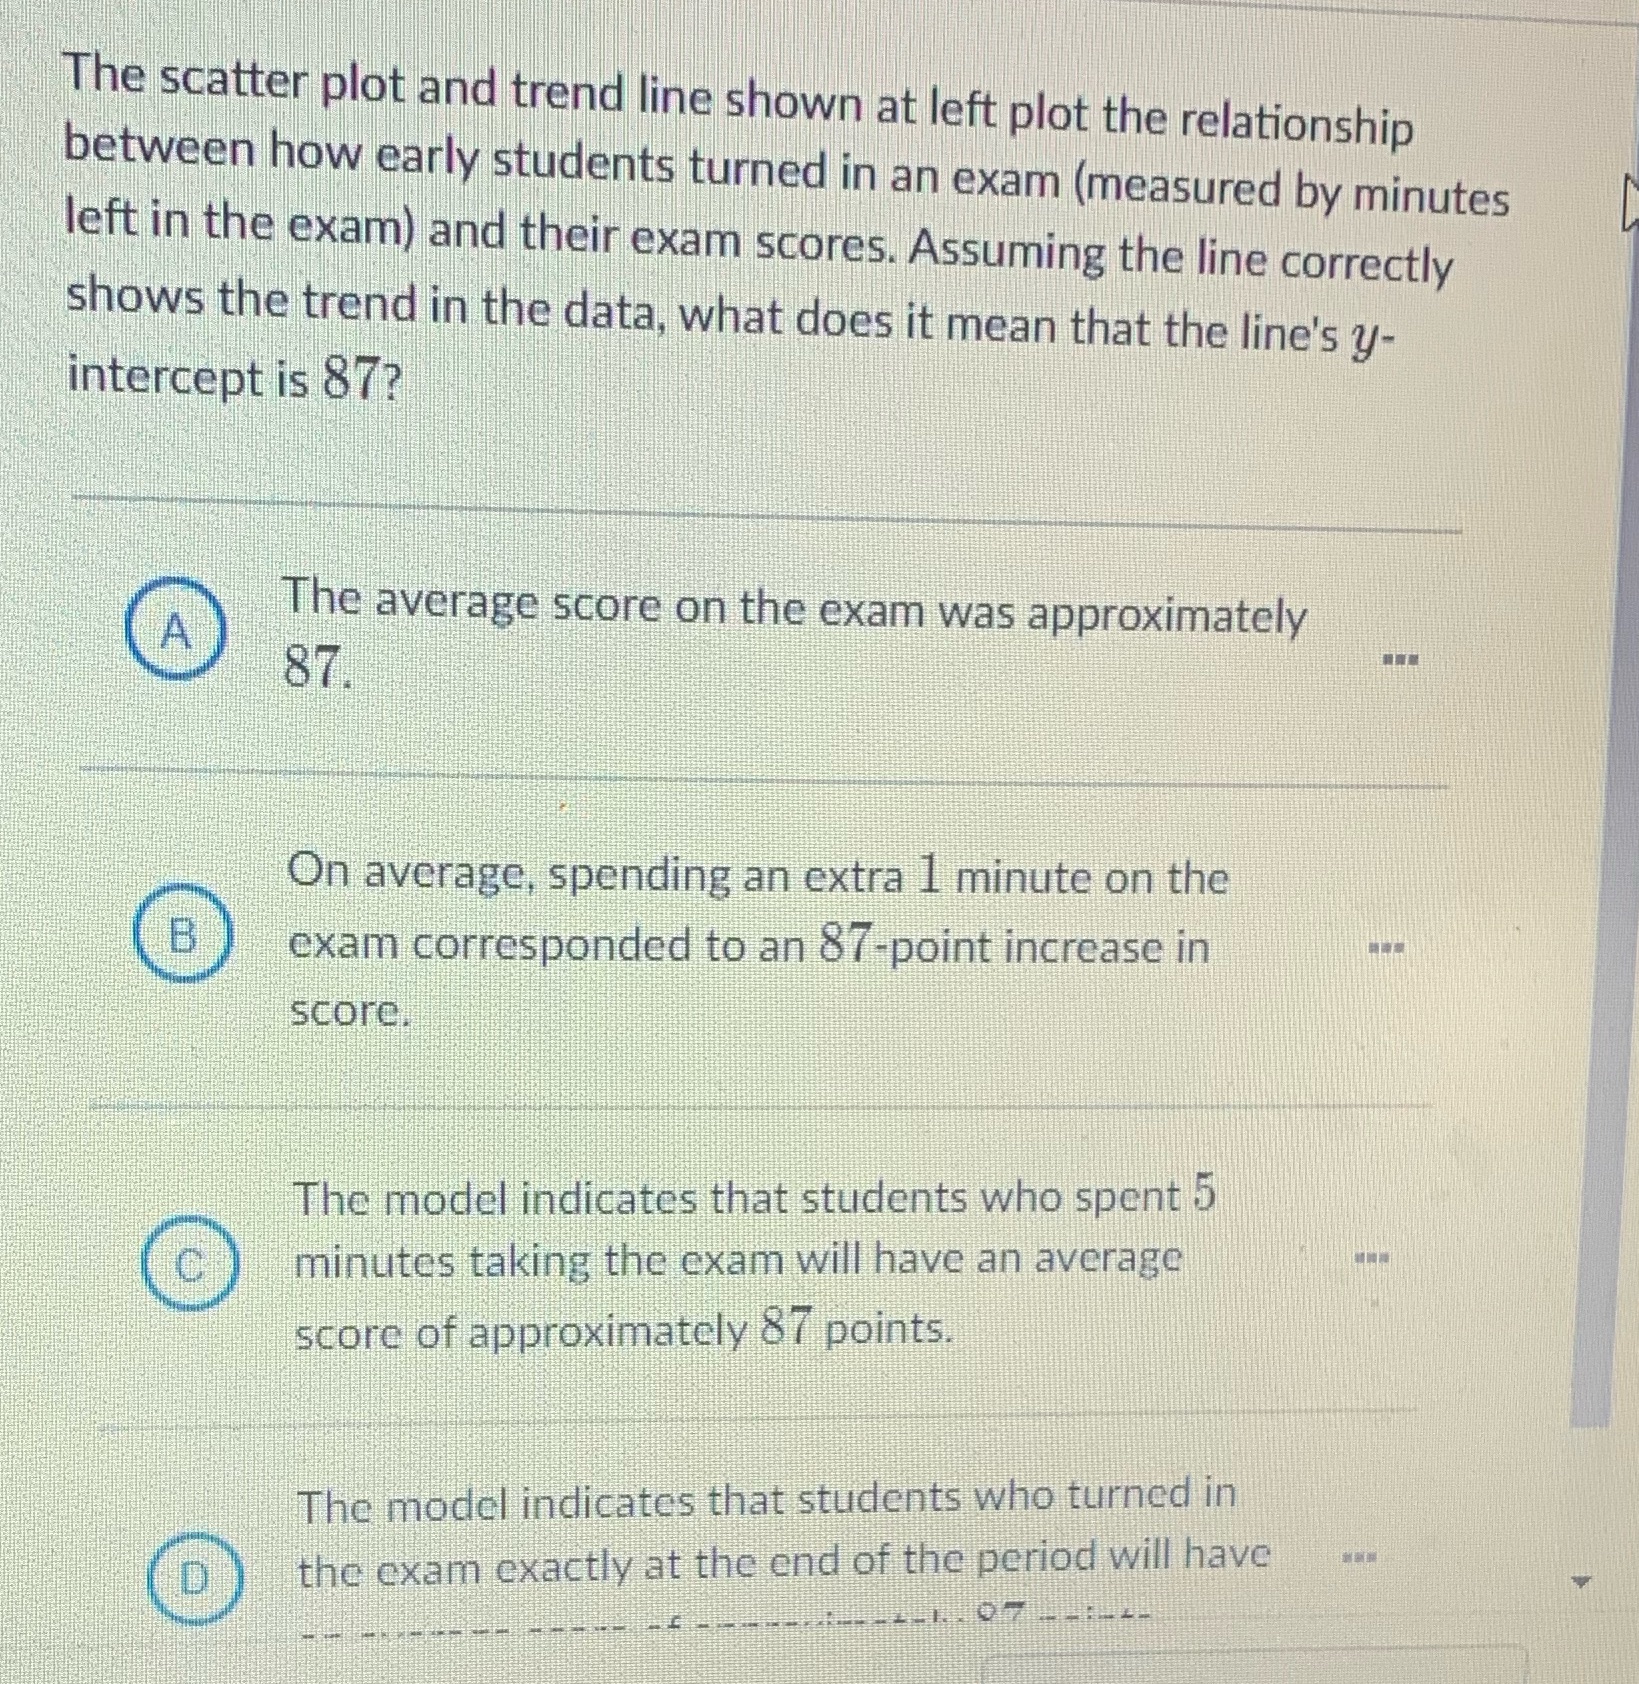
The scatter plot and trend line shown at left plot the relationship between how early students turned in an exam (measured by minutes left in the exam) and their exam scores. Assuming the line correctly shows the trend in the data, what does it mean that the line's y- intercept is 87? The average score on the exam was approximately 87. On average, spending an extra 1 minute on the B exam corresponded to an 87-point increase in score. The model indicates that students who spent 5 minutes taking the exam will have an average score of approximately 87 points. The model indicates that students who turned in D the exam exactly at the end of the period will have
Step by Step Solution
There are 3 Steps involved in it

Get step-by-step solutions from verified subject matter experts