

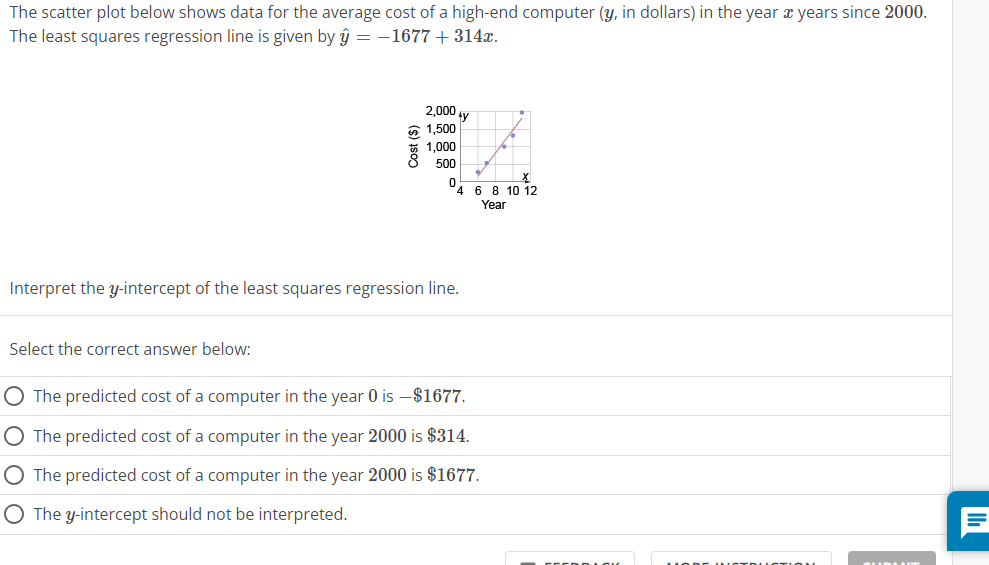
Question: The scatter plot below shows data for the average cost of a high-end computer (y, in dollars) in the year x years since 2000. The
Step by Step Solution
There are 3 Steps involved in it
1 Expert Approved Answer
Step: 1 Unlock

Question Has Been Solved by an Expert!
Get step-by-step solutions from verified subject matter experts
Step: 2 Unlock
Step: 3 Unlock