

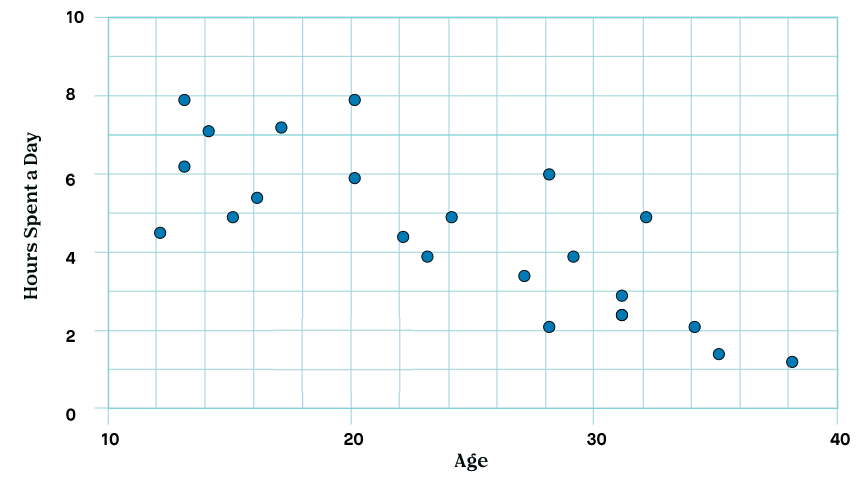
Question: The scatter plot below shows the average numbers of hours spent on a phone app vs user age.Approximate the age of a person who spends
The scatter plot below shows the average numbers of hours spent on a phone app vs user age.Approximate the age of a person who spends 6.5 hours a day on the app.
\f
Step by Step Solution
There are 3 Steps involved in it
1 Expert Approved Answer
Step: 1 Unlock

Question Has Been Solved by an Expert!
Get step-by-step solutions from verified subject matter experts
Step: 2 Unlock
Step: 3 Unlock