

Question: The scatter plot shows the average monthly temperature, x, and a family's monthly heating cost, , for 24 different months. (a) Write an approximate
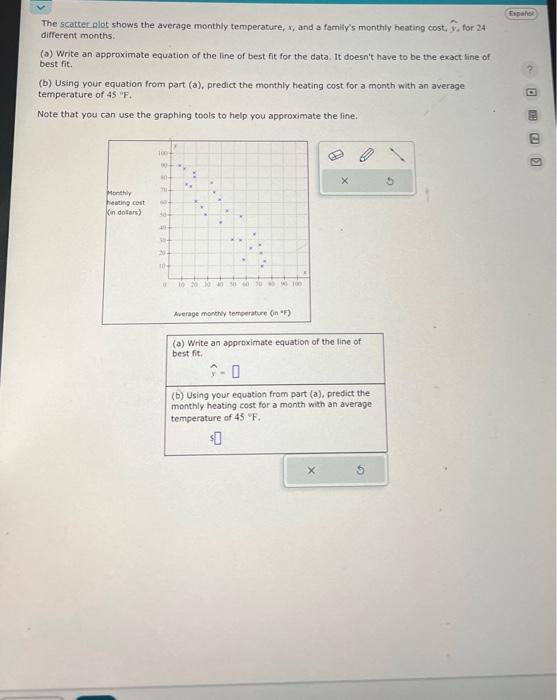
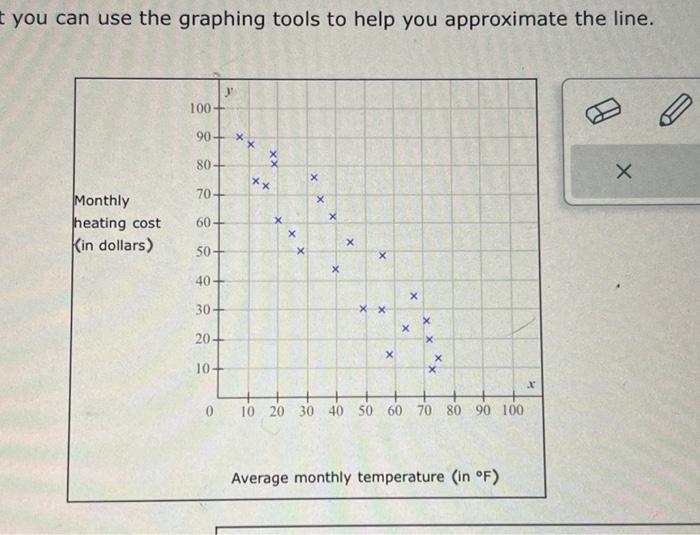
The scatter plot shows the average monthly temperature, x, and a family's monthly heating cost, , for 24 different months. (a) Write an approximate equation of the line of best fit for the data. It doesn't have to be the exact line of best fit. (b) Using your equation from part (a), predict the monthly heating cost for a month with an average temperature of 45 F. Note that you can use the graphing tools to help you approximate the line. Monthly 100- 00- 30- heating cost Kin dollars) 304 20 10+ 10 20 10 3060 30 50 100 x 5 Average monthly temperature (in "F) (a) Write an approximate equation of the line of best fit. (b) Using your equation from part (a), predict the monthly heating cost for a month with an average temperature of 45 "F. $0 Espaol t you can use the graphing tools to help you approximate the line. x 100- 88 Monthly heating cost 90+x. 80- 80 70- xx X x 60- x Kin dollars) 50- x x- 40 30- 20+ 10- X x x x x x x x 0 10 20 30 40 50 60 70 80 90 100 Average monthly temperature (in F) X
Step by Step Solution
There are 3 Steps involved in it

Get step-by-step solutions from verified subject matter experts