

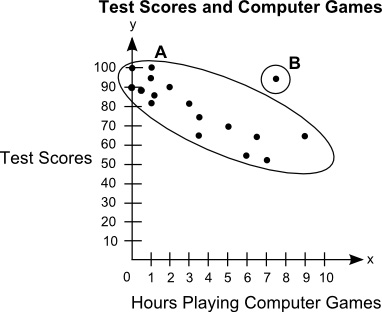
Question: The scatter plot shows the relationship between the test scores of a group of students and the number of hours they play computer games in
The scatter plot shows the relationship between the test scores of a group of students and the number of hours they play computer games in a week: Part A:What is the group of points labeled A called? What is the point labeled B called? Give a possible reason for the presence of point B. (5 points) Part B:Describe the association between students' test scores and the number of hours they play computer games. (5 points)
Step by Step Solution
There are 3 Steps involved in it
1 Expert Approved Answer
Step: 1 Unlock

Question Has Been Solved by an Expert!
Get step-by-step solutions from verified subject matter experts
Step: 2 Unlock
Step: 3 Unlock