

Question: The scatter plot shows the time spent studying, x, and the quiz score, y, for each of 25 students. (a) Write an approximate equation of
(a) Write an approximate equation of the line of best fit for the data. It doesn't have to be the exact line of best fit.
(b) Using your equation from part (a), predict the quiz score for a student who spent 50 minutes studying.
Note that you can use the graphing tools to help you approximate the line.
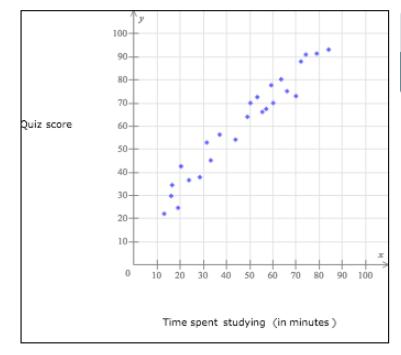
(a) Write an approximate equation of the line of best fit.
(b) Using your equation from part (a), predict the quiz score for a student who spent 50 minutes studying.
Quiz score 100 90- 80- 70 60- 50 40- 30 3 20+ 10 10 20 30 40 50 60 70 80 90 100 Time spent studying (in minutes)
Step by Step Solution
★★★★★
3.53 Rating (160 Votes )
There are 3 Steps involved in it
1 Expert Approved Answer
Step: 1 Unlock

Let data a Now and line So the is Thus line we Thus O Now using of slope b for line o... View full answer
Question Has Been Solved by an Expert!
Get step-by-step solutions from verified subject matter experts
Step: 2 Unlock
Step: 3 Unlock