

Question: The scatterplot below shows data for the nine french fry orders from the previous problem, with the least-squares regression line displayed. Which of the following
The scatterplot below shows data for the nine french fry orders from the previous problem, with the least-squares regression line displayed. Which of the following is the best estimate of the value of the residual for the point indicated by the arrow?
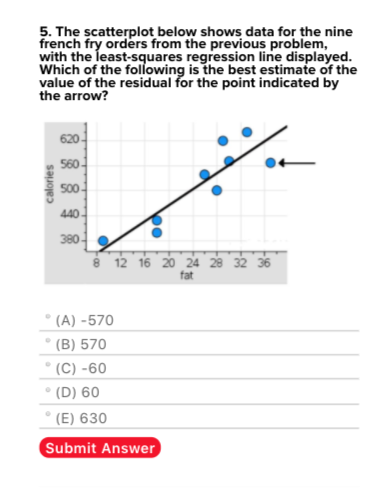
5. The scatterplot below shows data for the nine french fry orders from the previous problem, with the least-squares regression line displayed. Which of the following is the best estimate of the value of the residual for the point indicated by the arrow? 620 calories 560 $ 8 380 8 12 16 20 24 28 32 36 fat . (A) -570 . (B) 570 " (C) -60 . (D) 60 (E) 630 Submit
Step by Step Solution
There are 3 Steps involved in it
1 Expert Approved Answer
Step: 1 Unlock

Question Has Been Solved by an Expert!
Get step-by-step solutions from verified subject matter experts
Step: 2 Unlock
Step: 3 Unlock