

Question: The scatterplot below shows fabricated data for the price per share versus earnings per share per year of 100 public corporations. The average earnings per
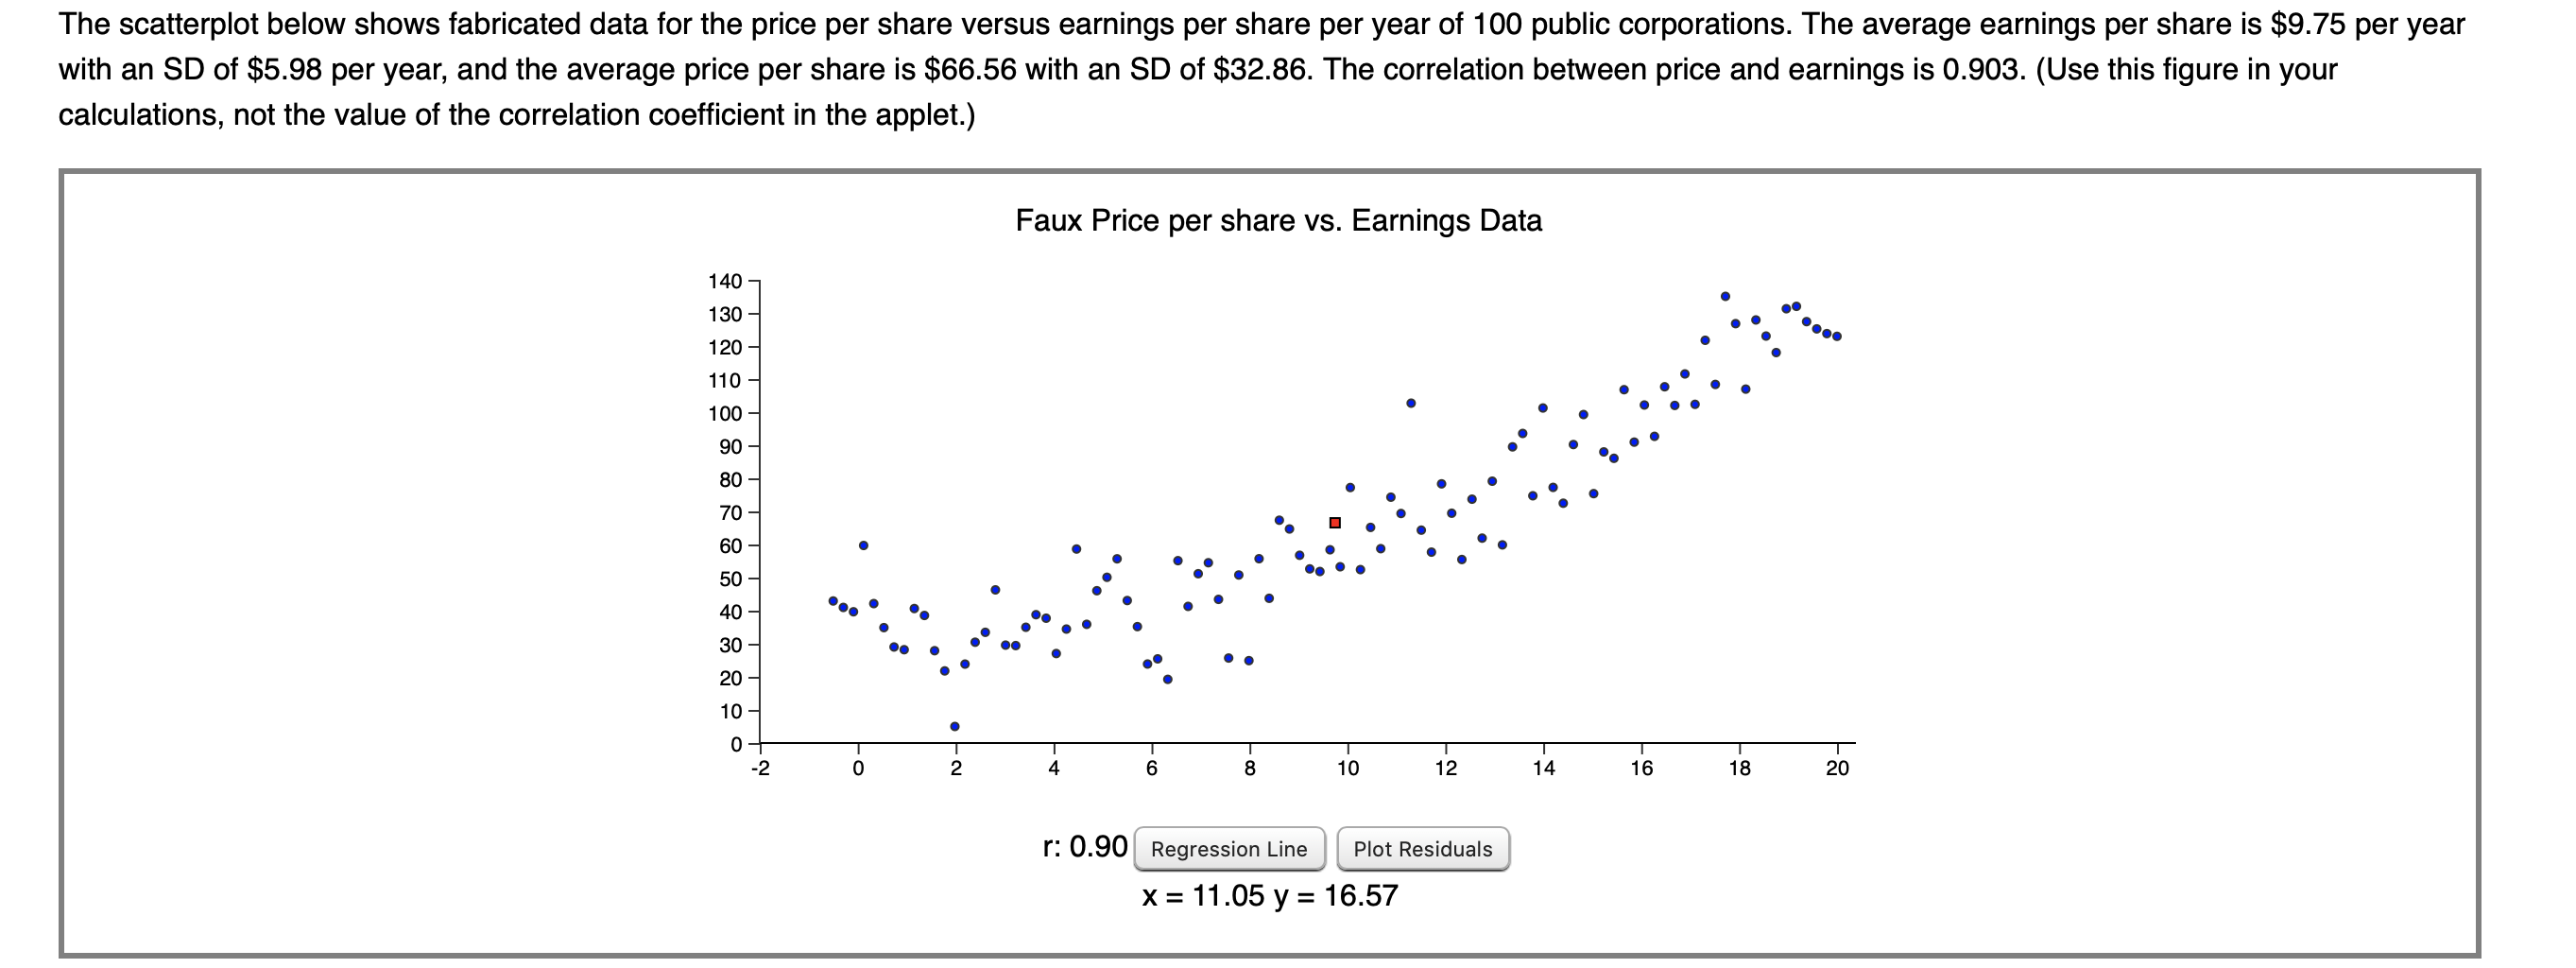
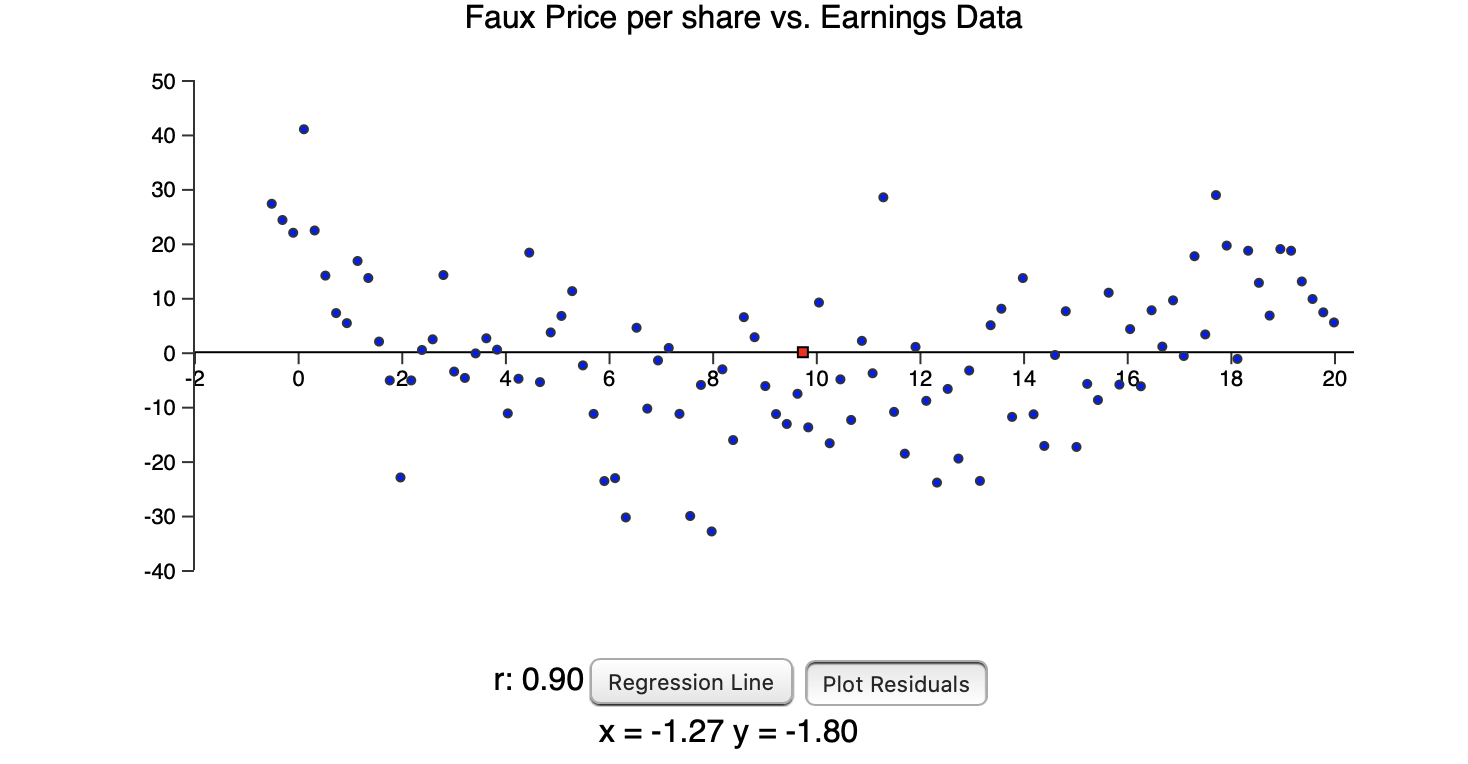
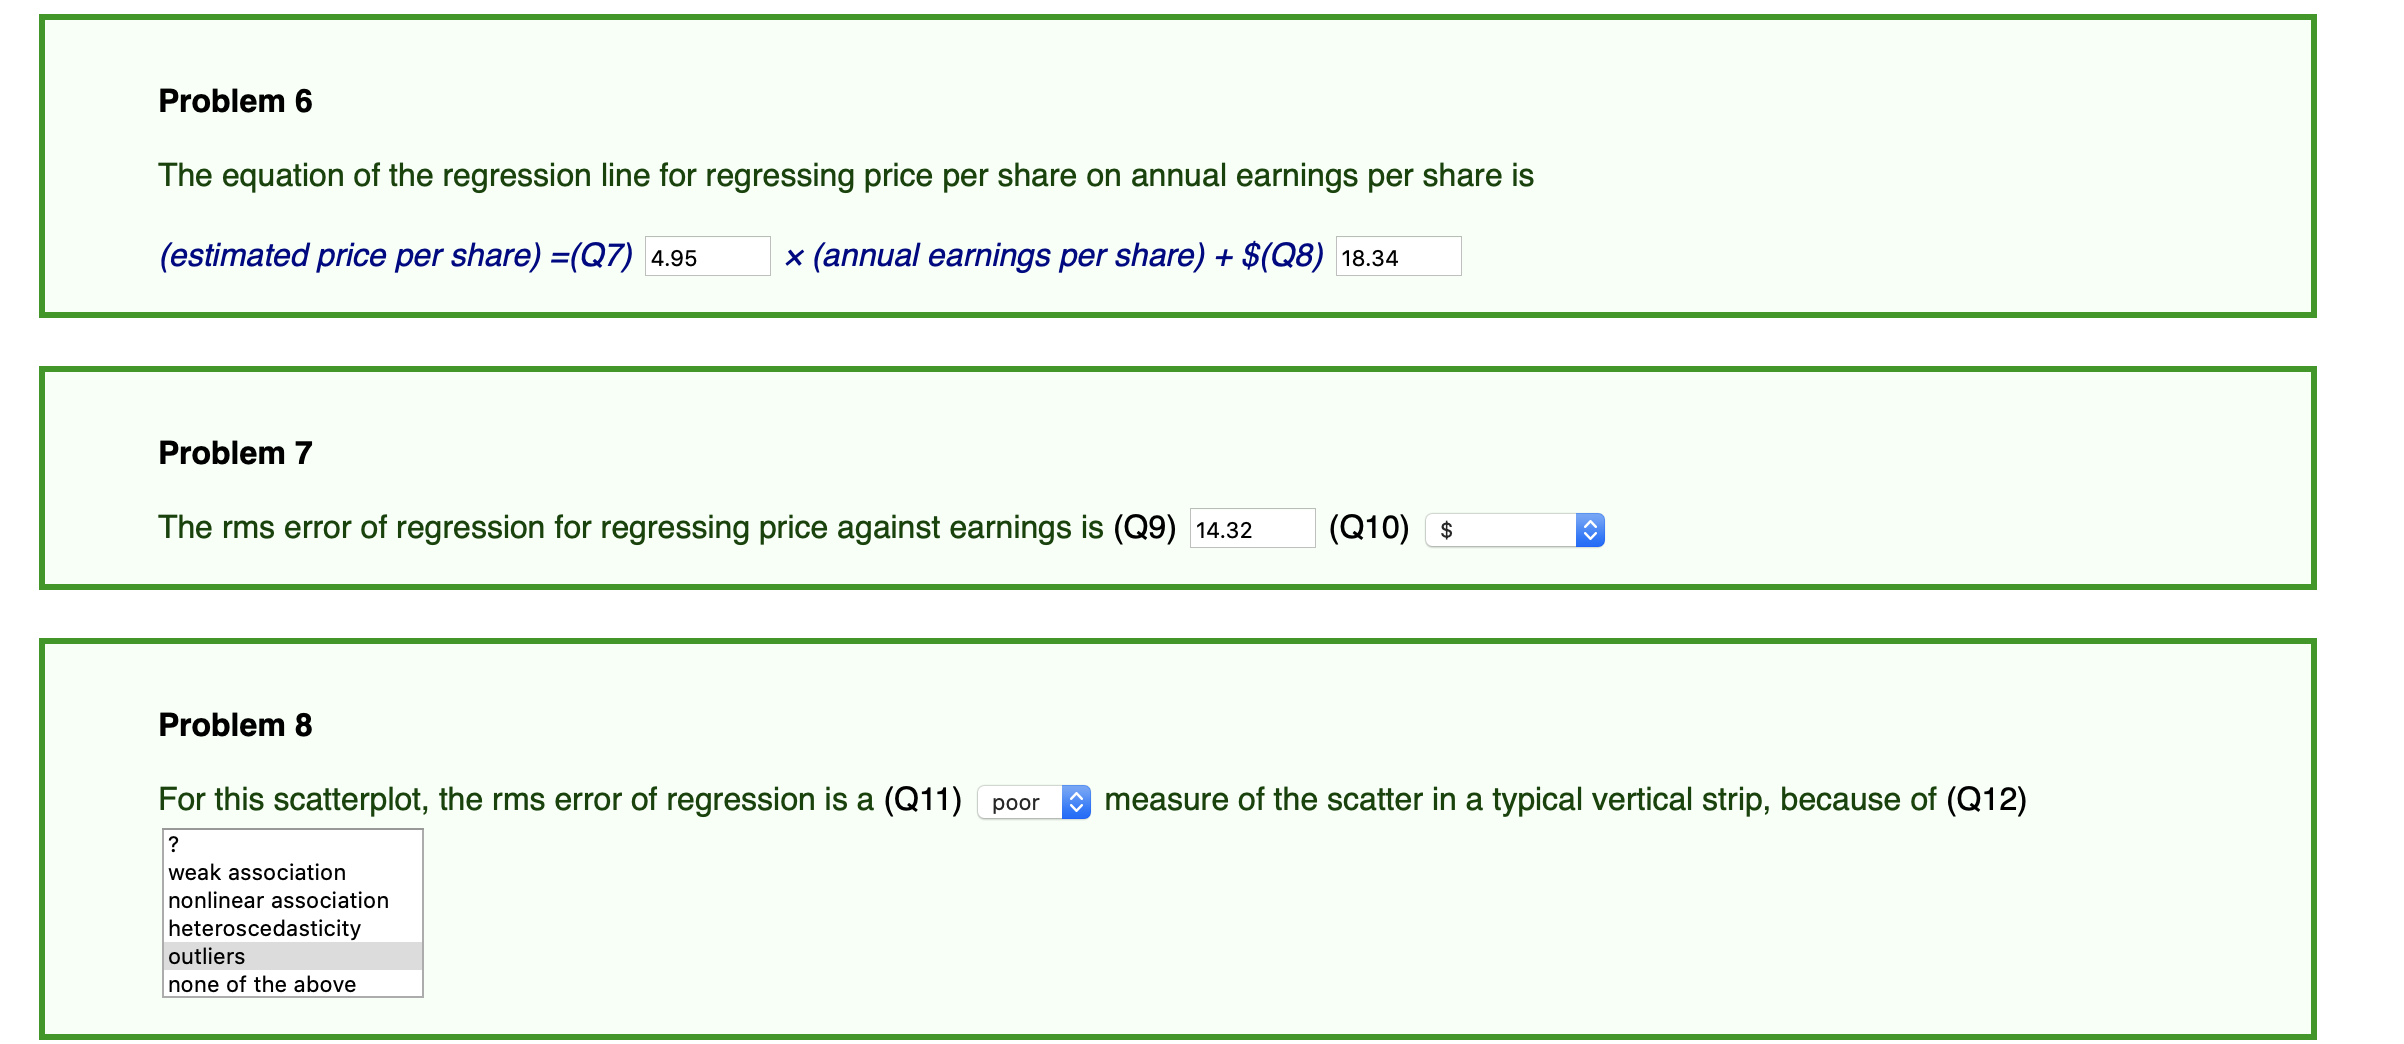
The scatterplot below shows fabricated data for the price per share versus earnings per share per year of 100 public corporations. The average earnings per share is $9.75 per year with an SD of $5.98 per year, and the average price per share is $66.56 with an SD of $32.86. The correlation between price and earnings is 0.903. (Use this figure in your calculations, not the value of the correlation coefficient in the applet.) Faux Price per share vs. Earnings Data r: 0.90 Plot Residuals x= 11.05y= 16.57 Faux Price per share vs. Earnings Data 50 40 30 . 20 10 - . O -2 0 . 20 40 6 10 . 12 14 76. 18 20 -10 -20 -30 -40 r: 0.90 Regression Line Plot Residuals X = -1.27 y = -1.80Problem 6 The equation of the regression line for regressing price per share on annual earnings per share is (estimated price per share) =(Q7) 435 x (annual earnings per share) + $(08) 18.34 Problem 7 The rms error of regression for regressing price against earnings is (09) 14.32 (010) s a Problem 8 For this scatterplot, the rms error of regression is a (Q11) poor 3 measure of the scatter in a typical vertical strip, because of (012) ? weak association nonlinear association heteroscedasticity outliers none of the above
Step by Step Solution
There are 3 Steps involved in it

Get step-by-step solutions from verified subject matter experts