

Question: The scatterplot below shows the relationship between poverty rate, y, in the 51 states in the US (including DC) and the high school graduation rate,
The scatterplot below shows the relationship between poverty rate, y, in the 51 states in the US (including DC) and the high school graduation rate, x. The linear regression equation for predicting poverty is as follows:
y=64.68?0.62xy=64.68-0.62x
The actual high school graduation rate for a certain state is 85.8%, and the actual poverty rate in that state is 12.984%. What is theresidualfor this observation?
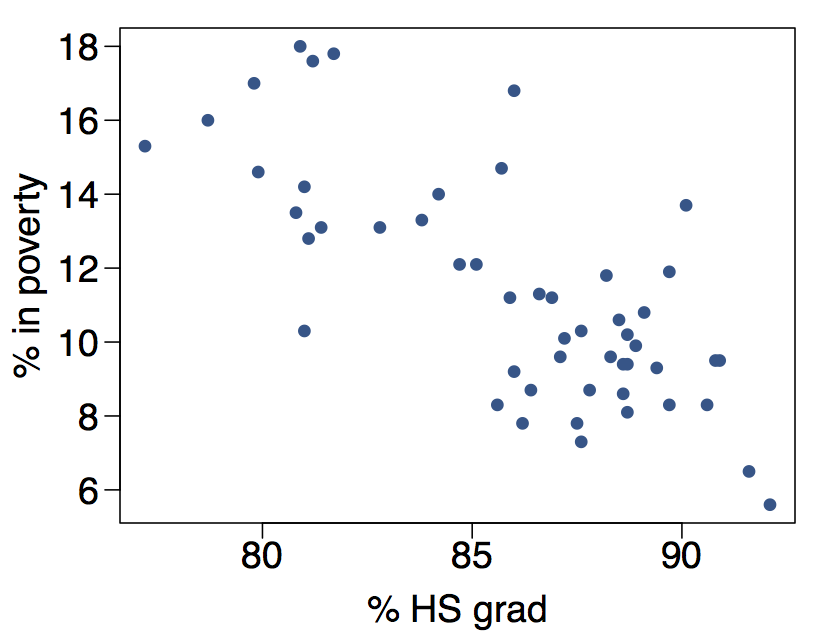
18 16 14 % in poverty 12 .. 10 80 85 90 % HS grad
Step by Step Solution
There are 3 Steps involved in it
1 Expert Approved Answer
Step: 1 Unlock

Question Has Been Solved by an Expert!
Get step-by-step solutions from verified subject matter experts
Step: 2 Unlock
Step: 3 Unlock