

Question: The scatterplot below shows the relationship between the state-wide average SAT writing score in 2010 and in 2014. 600 580 560 540 520 State-wide average
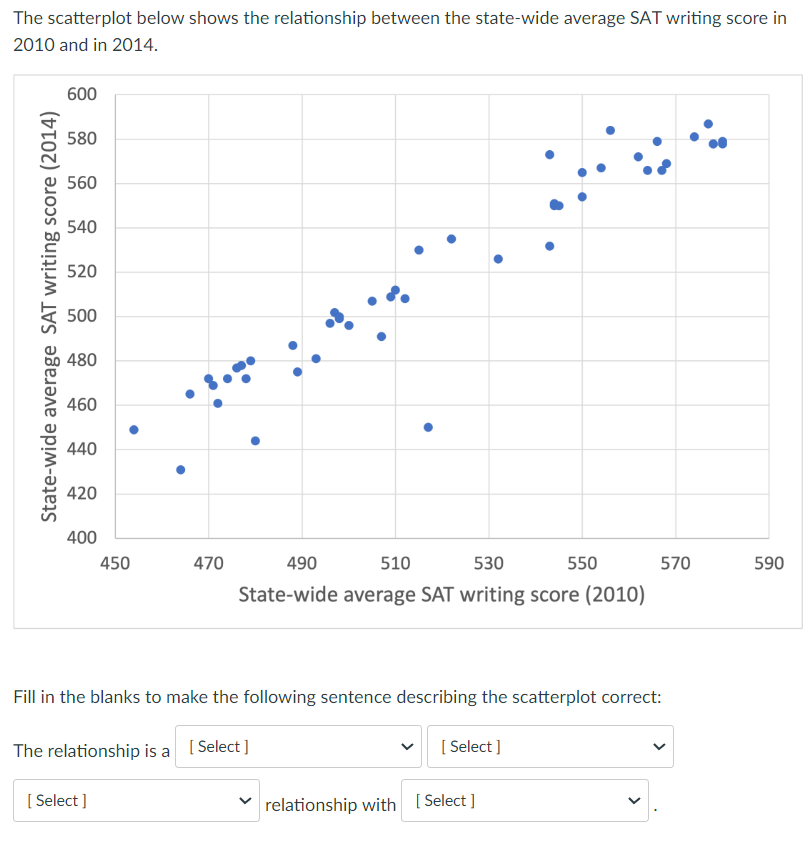
The scatterplot below shows the relationship between the state-wide average SAT writing score in 2010 and in 2014. 600 580 560 540 520 State-wide average SAT writing score (2014) 500 480 460 440 420 400 450 470 490 510 530 550 570 590 State-wide average SAT writing score (2010) Fill in the blanks to make the following sentence describing the scatterplot correct: The relationship is a [ Select ] [ Select ] [ Select ] v relationship with [ Select ]
Step by Step Solution
There are 3 Steps involved in it
1 Expert Approved Answer
Step: 1 Unlock

Question Has Been Solved by an Expert!
Get step-by-step solutions from verified subject matter experts
Step: 2 Unlock
Step: 3 Unlock