

Question: The scatterplot below shows the relationship, per capita, between gross domestic product (GDP) (in $) and consumption of chocolate per year (in kilograms (kg)) for

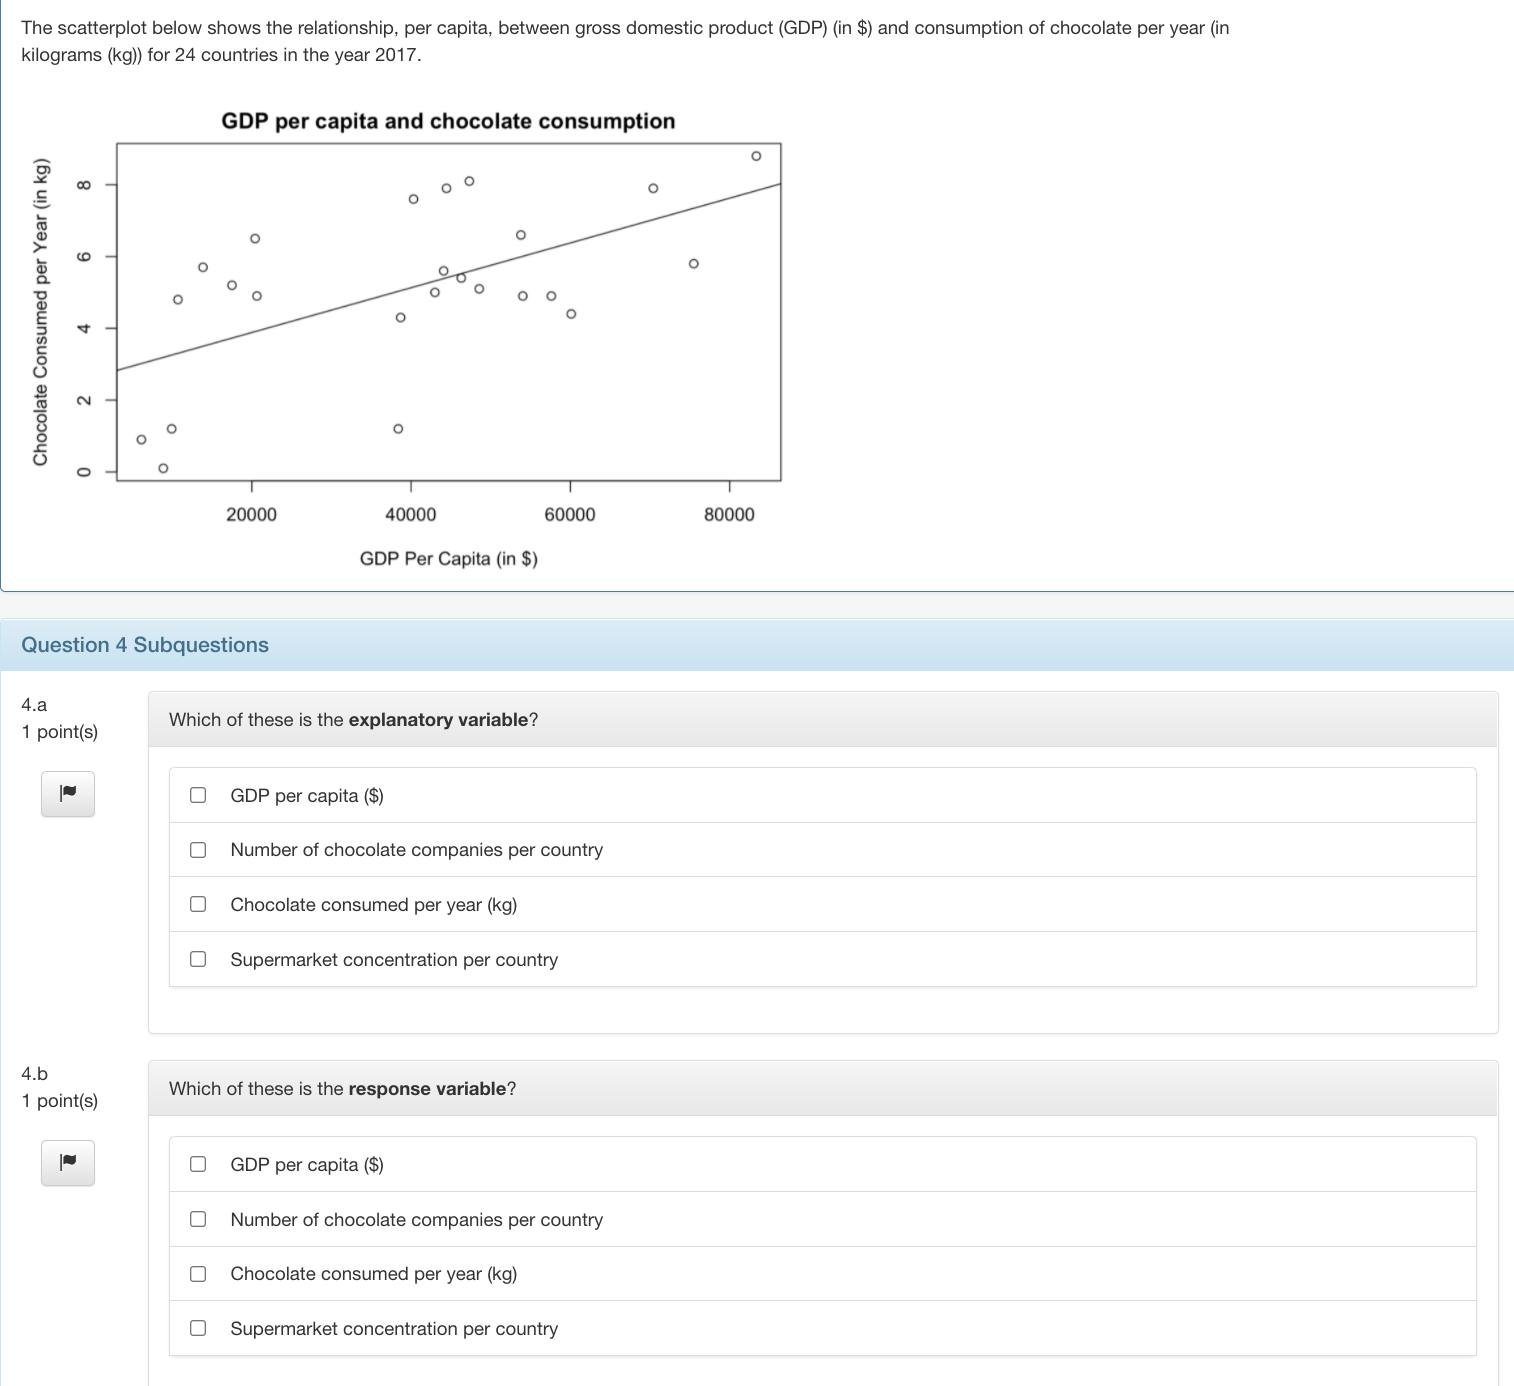

The scatterplot below shows the relationship, per capita, between gross domestic product (GDP) (in $) and consumption of chocolate per year (in kilograms (kg)) for 24 countries in the year 2017. GDP per capita and chocolate consumption CO Chocolate Consumed per Year (in kg) C O O 20000 40000 60000 80000 GDP Per Capita (in $) Question 4 Subquestions 4.a Which of these is the explanatory variable? 1 point(s) GDP per capita ($) Number of chocolate companies per country Chocolate consumed per year (kg) Supermarket concentration per country 4.b 1 point(s) Which of these is the response variable? O GDP per capita ($) Number of chocolate companies per country O Chocolate consumed per year (kg) O Supermarket concentration per countryDescribe the relationship between the two variables. Make sure to discuss any unusual features, if any. No answer entered. Click above to enter an answer. Is this statement true or false? 'We can conclude that if a country has a higher GDP per capita, it will result in a higher chocolate cansumption.I C] True D False
Step by Step Solution
There are 3 Steps involved in it

Get step-by-step solutions from verified subject matter experts