

Question: The scatterplot on the left shows the relationship between the height of bubbles blown into the air in relation to the time that has
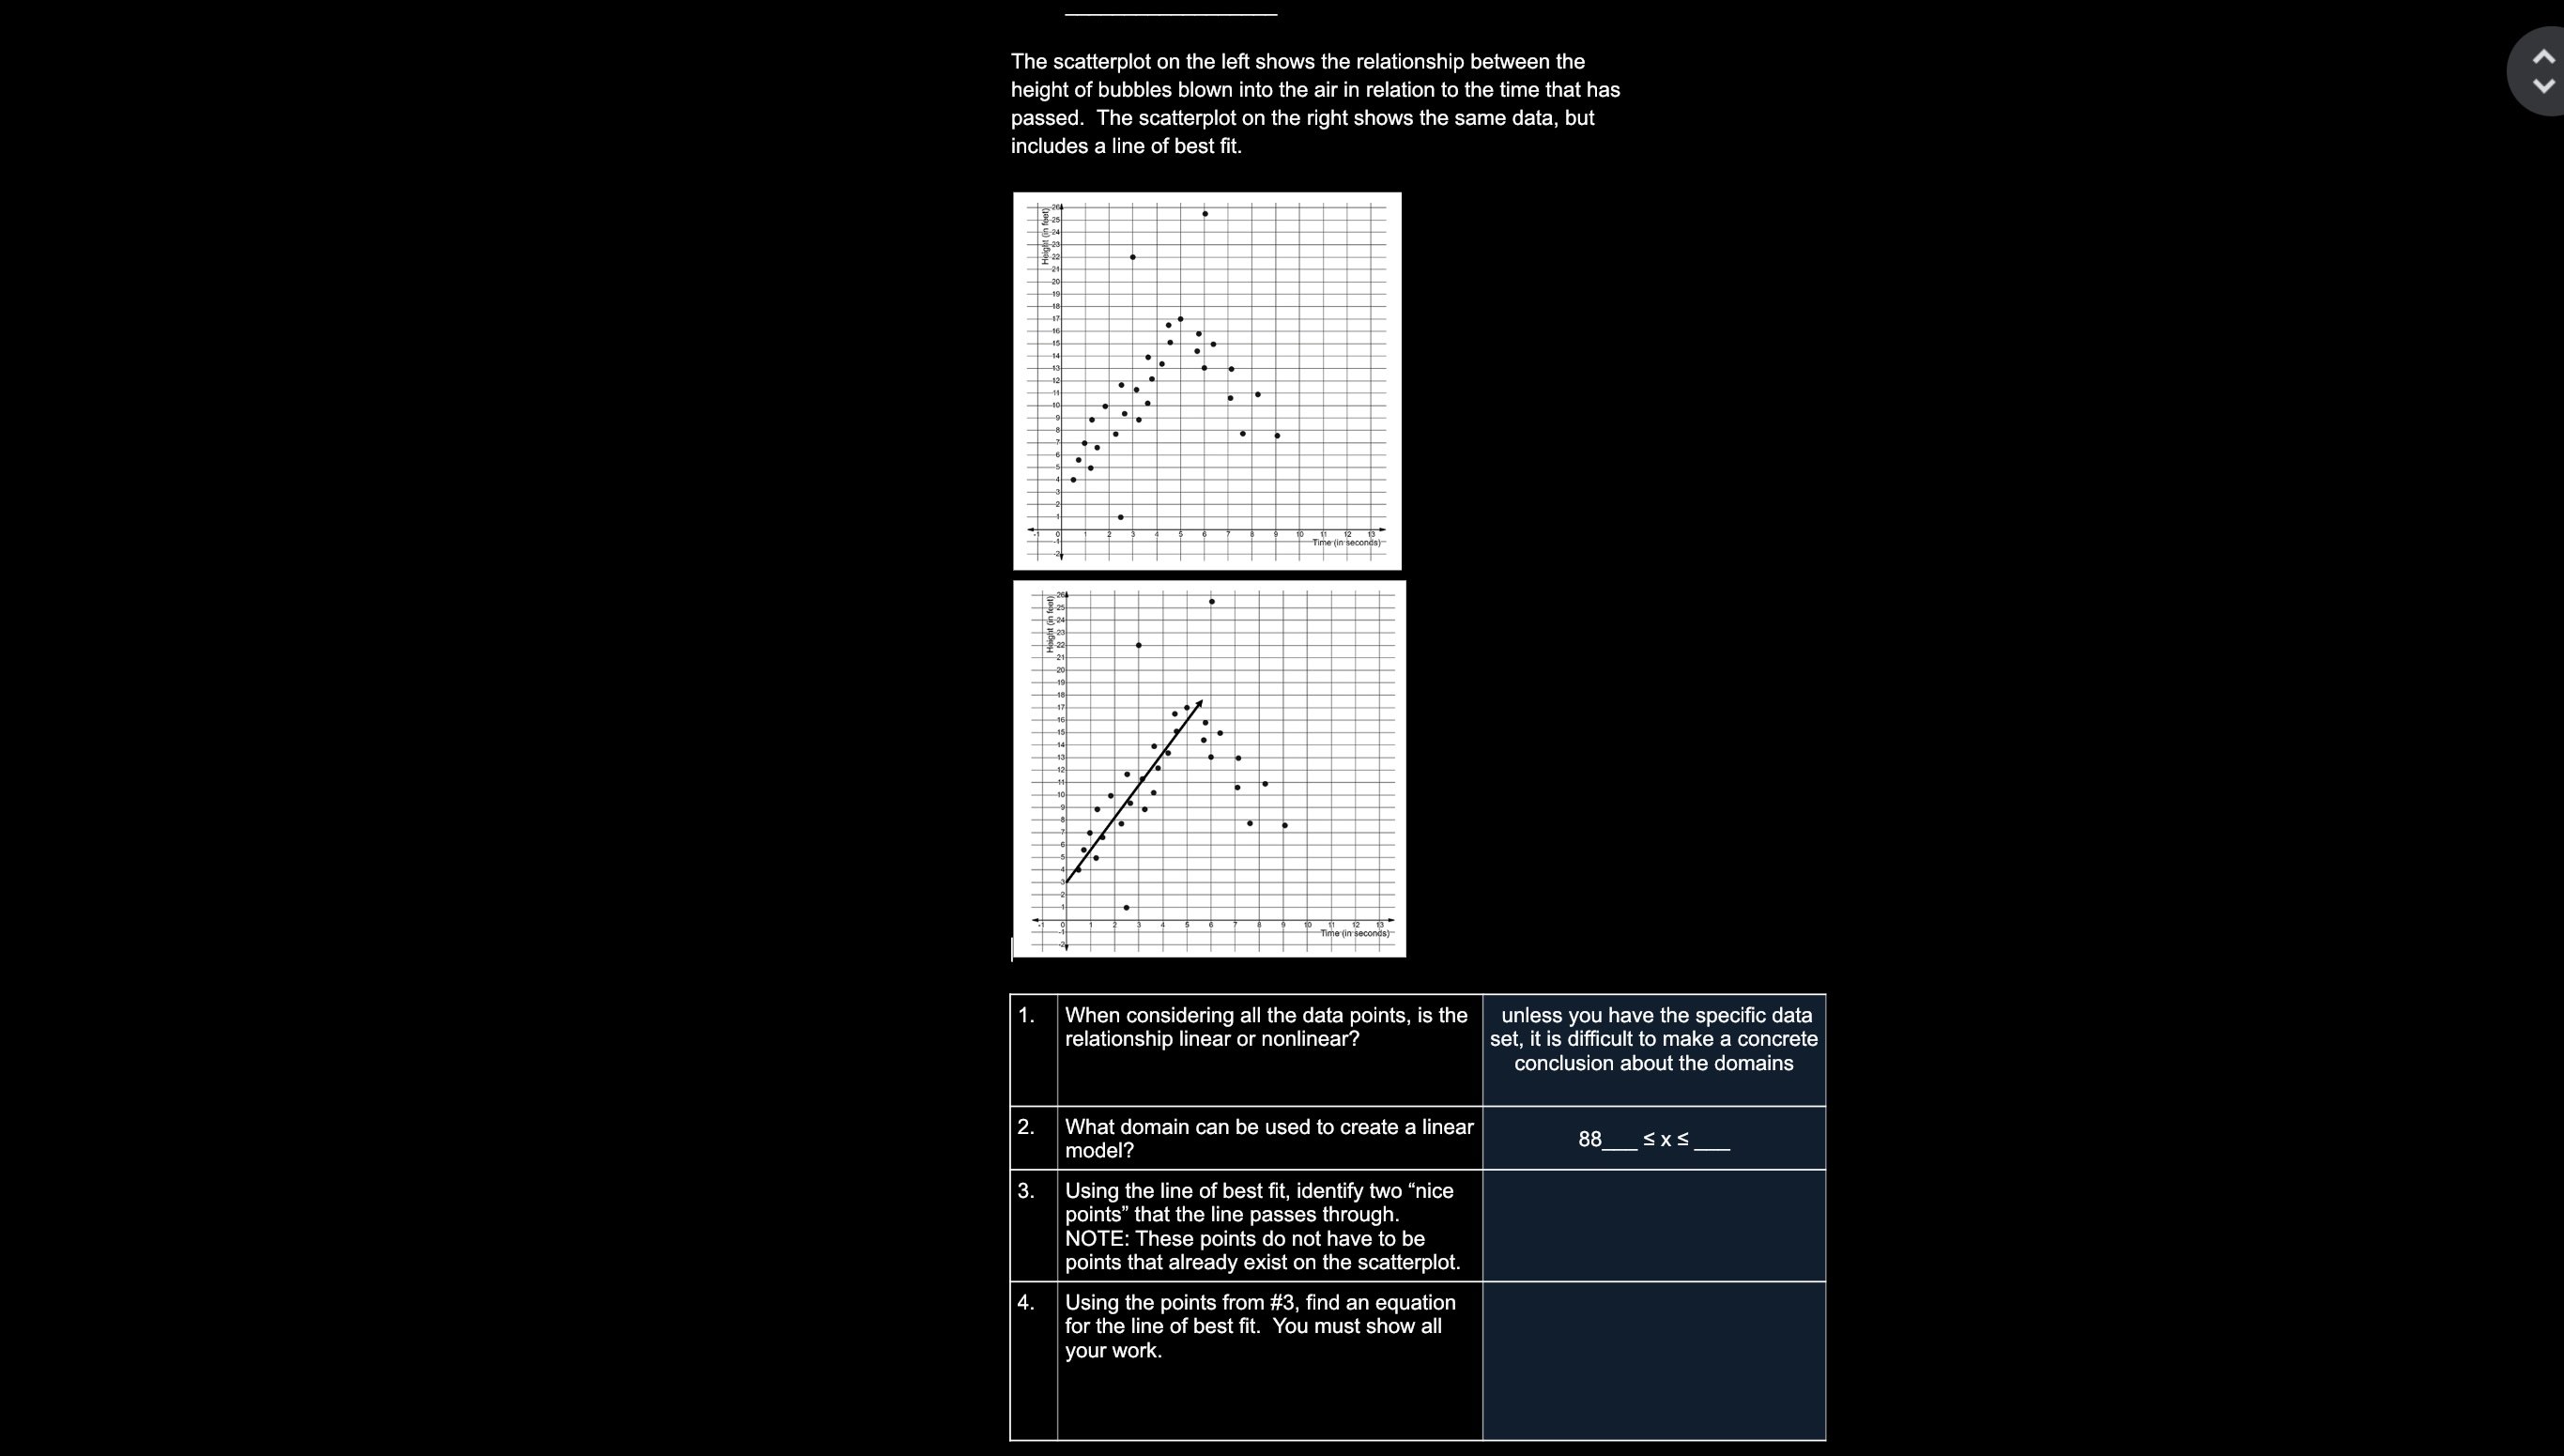
The scatterplot on the left shows the relationship between the height of bubbles blown into the air in relation to the time that has passed. The scatterplot on the right shows the same data, but includes a line of best fit. 1. E-23 22 21 20 19 17 16 14 -10 . . Time (in seconds) Time (in seconds) When considering all the data points, is the relationship linear or nonlinear? unless you have the specific data set, it is difficult to make a concrete conclusion about the domains 2. What domain can be used to create a linear model? 88 x 3. Using the line of best fit, identify two "nice points" that the line passes through. NOTE: These points do not have to be points that already exist on the scatterplot. 4. Using the points from #3, find an equation for the line of best fit. You must show all your work.
Step by Step Solution
There are 3 Steps involved in it

Get step-by-step solutions from verified subject matter experts