

Question: The scatterplot reveals a point outside the point pattern. Copy the data to a new location in the worksheet. You now have 2 sets of
The scatterplot reveals a point outside the point pattern. Copy the data to a new location in the worksheet. You now have 2 sets of data. Data that are more than 1.5 IQR below Q1 or more than 1.5 IQR above Q3 are considered outliers and must be investigated. It was determined that the outlying point resulted from data entry error. Remove the outlier in the copy of the data. Make a new scatterplot linked to the cleaned data without the outlier, and add title ("Scatterplot without Outlier,") trendline, and regression equation label.
What is the trendline and regression for this data?
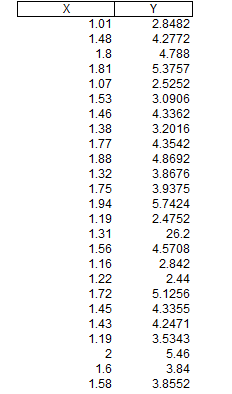
X Y 1.01 2.8482 1.48 4.2772 1.8 4.788 1.81 5.3757 1.07 2.5252 1.53 3.0906 1.46 4.3362 1.38 3.2016 1.77 4.3542 1.88 4.8692 1.32 3.8676 1.75 3.9375 1.94 5.7424 1.19 2.4752 1.31 26.2 1.56 4.5708 1.16 2.842 1.22 2.44 1.72 5.1256 1.45 4.3355 1.43 4.2471 1.19 3.5343 2 5.46 1.6 3.84 1.58 3.8552
Step by Step Solution
There are 3 Steps involved in it

Get step-by-step solutions from verified subject matter experts