

Question: The scatterplot shows four fixed points: (1,2), (2,6), (4,2), and (5,6). State the correlation and the equation of the line of best fit (?1 )
The scatterplot shows four fixed points: (1,2), (2,6), (4,2), and (5,6). State the correlation and the equation of the line of best fit (?1 ) on Desmos) for these four points. r =.3112 y? = 2.8+.4x
A point that dramatically changes the apparent slope of the regression line is called an influential point. Let (?, ?) be a fifth "wandering point." Investigate the influence of this fifth wandering point on the correlation and slope. Note whether the wandering point has either no residual or an estimated small, medium, or large residual. Also note what kind of leverage the wandering point has: none, low, or high. Use the sliders for c and d to change the wandering point to the points A to G below. You can also animate the wandering point to see how the regression model (??2 ) on Desmos) and correlation changes
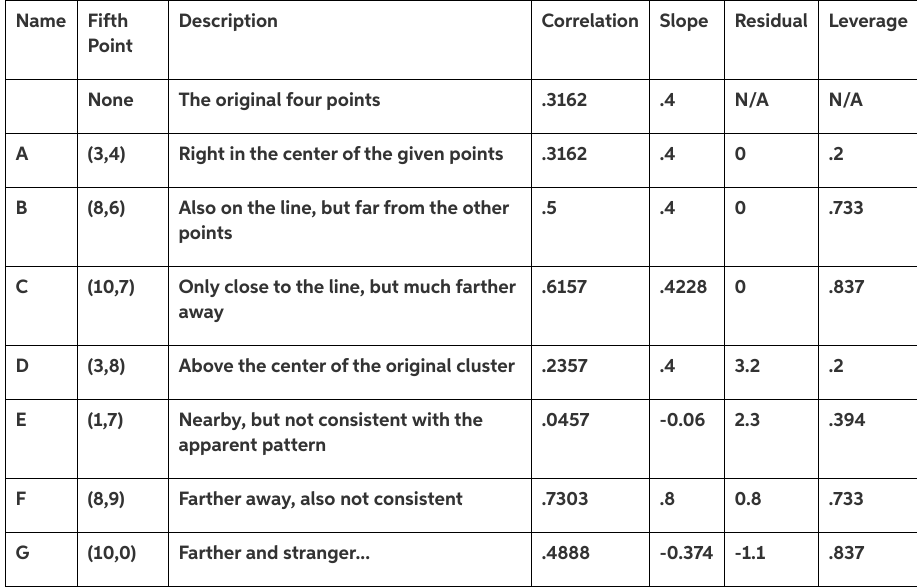
Name Fifth Description Correlation Slope Residual Leverage Point None The original four points .3162 .4 N/A N/A A (3,4) Right in the center of the given points .3162 .4 0 .2 B (8,6) Also on the line, but far from the other .5 .4 0 733 points C (10,7) Only close to the line, but much farther .6157 .4228 0 837 away D (3,8) Above the center of the original cluster .2357 .4 3.2 .2 E (1,7) Nearby, but not consistent with the .0457 -0.06 2.3 .394 apparent pattern F (8,9) Farther away, also not consistent .7303 .8 0.8 733 G (10,0) Farther and stranger... .4888 -0.374 -1.1 .837
Step by Step Solution
There are 3 Steps involved in it

Get step-by-step solutions from verified subject matter experts