

Question: The scatterplot shows the correlation between infant mortality rate (number of deaths per 1000 infants born) and the life expectancy (years) from various countries around
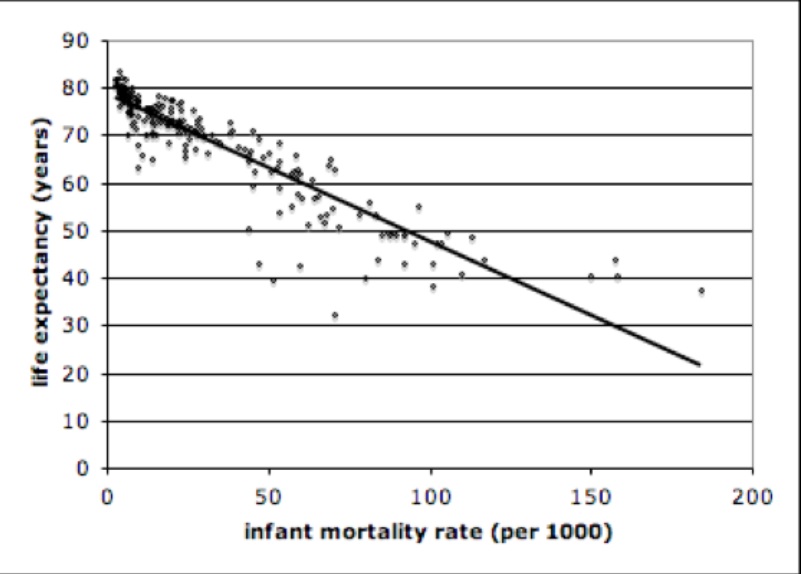
The scatterplot shows the correlation between infant mortality rate (number of deaths per 1000 infants born) and the life expectancy (years) from various countries around the world. The data graphed is from the year 2000. The straight line that fits the scatterplot the best is also graphed.
1. Based on your data, can you say that an increase in infant mortality rate causes a decrease in life expectancy? Explain.
2. Even though an increase in infant mortality rate doesnt cause a decrease in life expectancy, the two are obviously correlated. Can you think of a variable or variables that would explain the correlation? (Such variables are called confounding, or lurking, variables.) That is, if you were a researcher and wanted to gather data on variables that affect both infant mortality rate and life expectancy, what would they be? Explain.
Step by Step Solution
There are 3 Steps involved in it

Get step-by-step solutions from verified subject matter experts