

Question: The scatterplot to the right shows the cumulative number of reported deaths from a particular disease. The data may be 400- 350- modeled x years
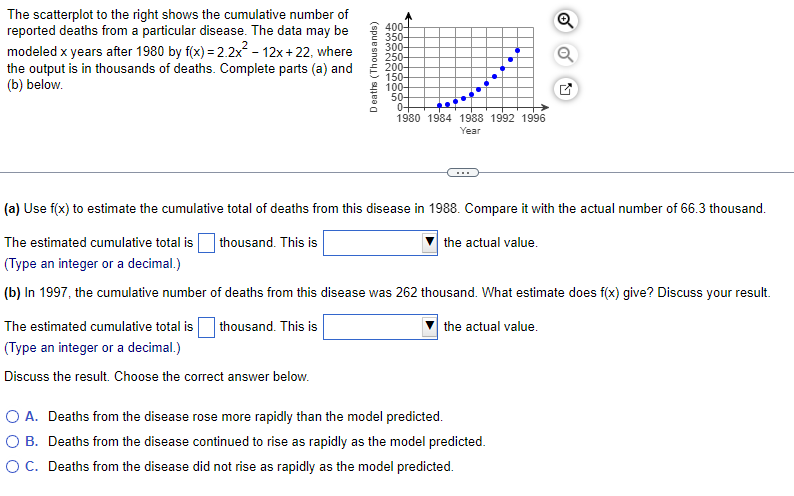
The scatterplot to the right shows the cumulative number of reported deaths from a particular disease. The data may be 400- 350- modeled x years after 1980 by f(x) =2.2x - 12x + 22, where 300- 250- the output is in thousands of deaths. Complete parts (a) and Deaths (Thousands) 200- 150- (b) below. 100- 50- 0- 1980 1984 1988 1992 1996 Year (a) Use f(x) to estimate the cumulative total of deaths from this disease in 1988. Compare it with the actual number of 66.3 thousand. The estimated cumulative total is thousand. This is the actual value. (Type an integer or a decimal.) (b) In 1997, the cumulative number of deaths from this disease was 262 thousand. What estimate does f(x) give? Discuss your result. The estimated cumulative total is thousand. This is the actual value. (Type an integer or a decimal.) Discuss the result. Choose the correct answer below. O A. Deaths from the disease rose more rapidly than the model predicted. O B. Deaths from the disease continued to rise as rapidly as the model predicted. O C. Deaths from the disease did not rise as rapidly as the model predicted
Step by Step Solution
There are 3 Steps involved in it

Get step-by-step solutions from verified subject matter experts