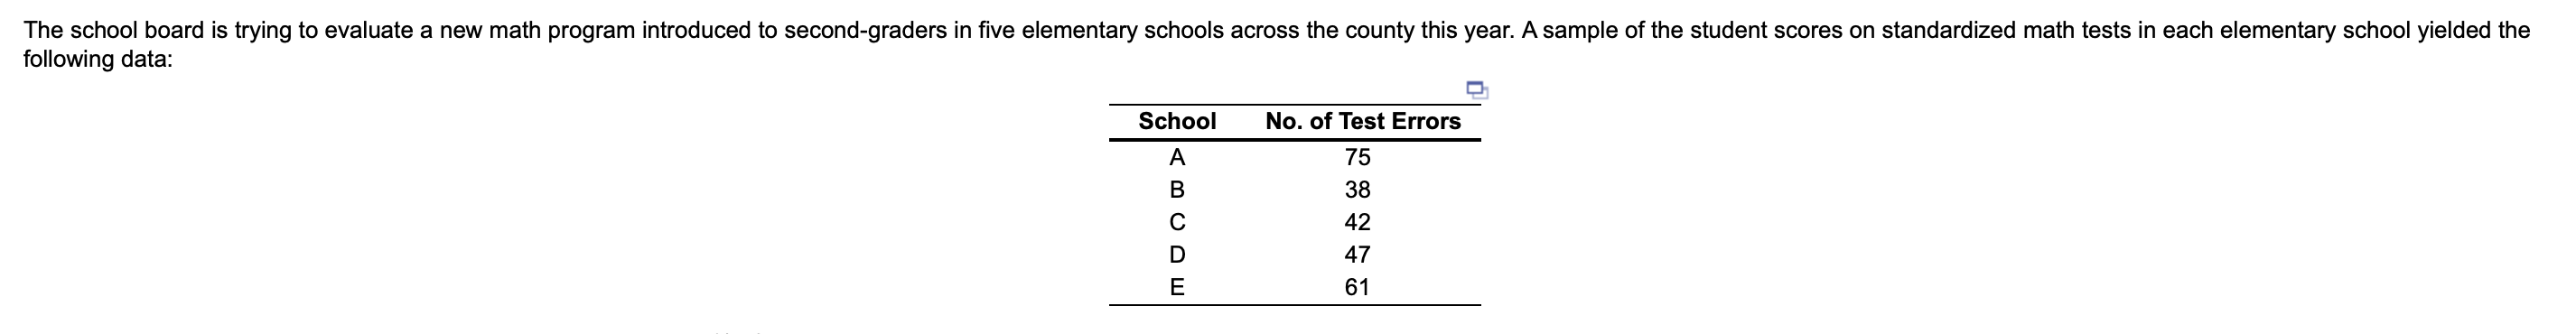
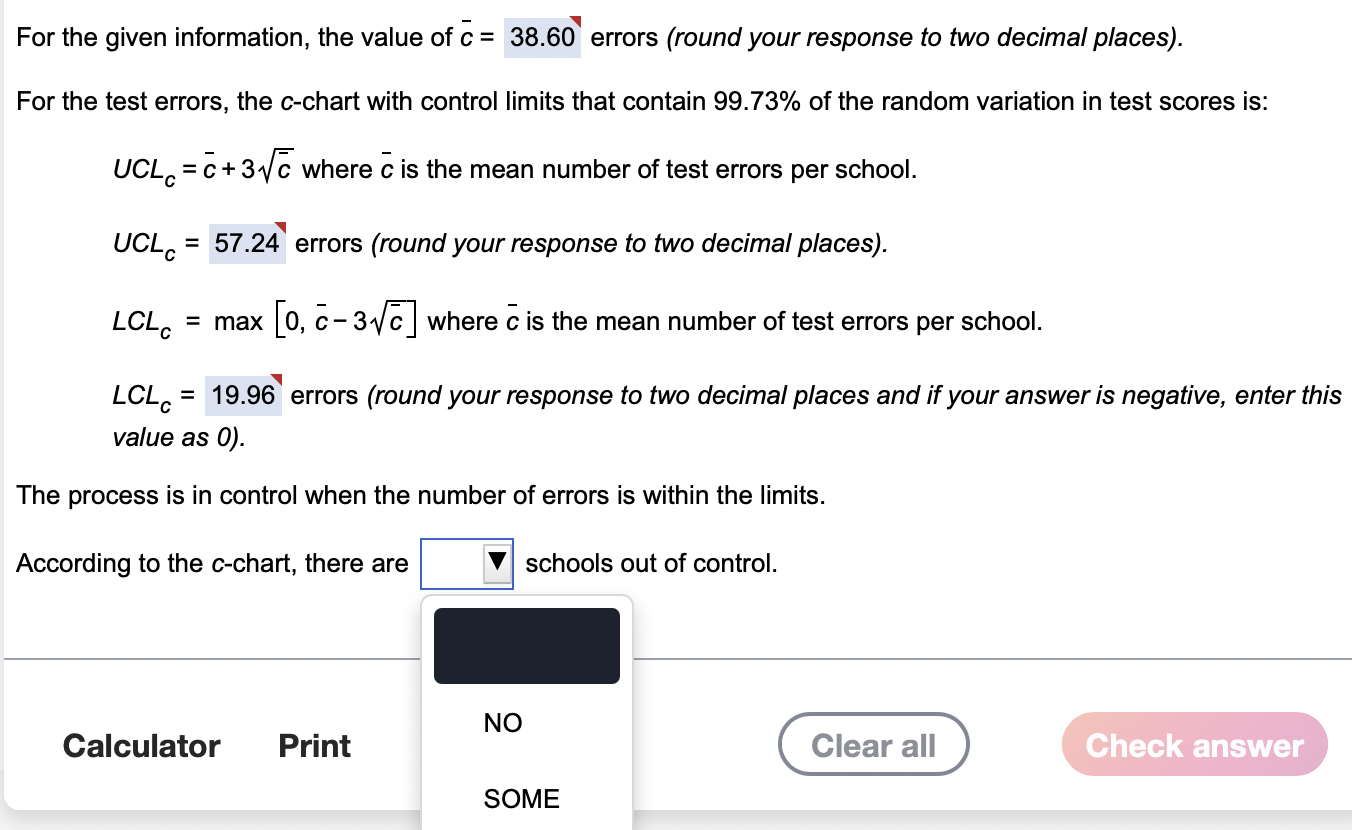
Question: The school board is trying to evaluate a new math program introduced to second-graders in five elementary schools across the county this year. A sample

The school board is trying to evaluate a new mathThe school board is trying to evaluate a new math

The school board is trying to evaluate a new math program introduced to second-graders in five elementary schools across the county this year. A sample of the student scores on standardized math tests in each elementary school yielded the following data: School No. of Test Errors A 75 38 42 E8RHG m Uw D 47 61 E For the given information, the value of C = 38.60 errors (round your response to two decimal places). For the test errors, the c-chart with control limits that contain 99.73% of the random variation in test scores is: UCLE=C+31+ where c is the mean number of test errors per school. c UCLC = 57.24 errors (round your response to two decimal places). LCL. = max [0, -317] where c is the mean number of test errors per school. LCLC = = 19.96 errors (round your response to two decimal places and if your answer is negative, enter this value as 0). The process is in control when the number of errors is within the limits. According to the c-chart, there are schools out of control. NO Calculator Print Clear all Check answer SOME

Step by Step Solution

There are 3 Steps involved in it

1 Expert Approved Answer
Step: 1 Unlock blur-text-image
Question Has Been Solved by an Expert!

Get step-by-step solutions from verified subject matter experts

Step: 2 Unlock
Step: 3 Unlock

Students Have Also Explored These Related General Management Questions!