

Question: The score on a standardized test for a certain year is modeled using the normal distribution shown below. The mean of the distribution is 72.7
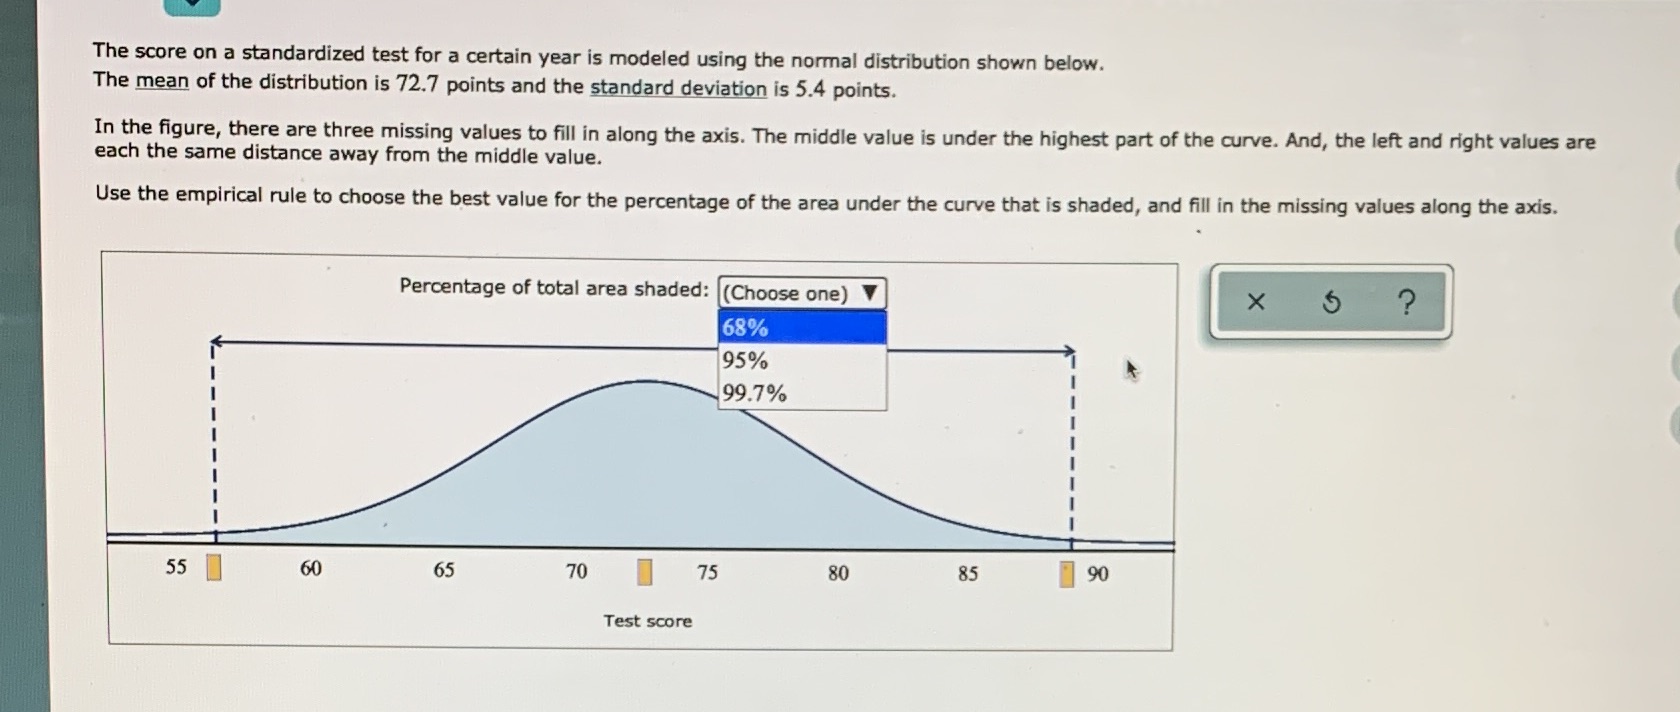

The score on a standardized test for a certain year is modeled using the normal distribution shown below. The mean of the distribution is 72.7 points and the standard deviation is 5.4 points. In the figure, there are three missing values to fill in along the axis. The middle value is under the highest part of the curve. And, the left and right values are each the same distance away from the middle value. Use the empirical rule to choose the best value for the percentage of the area under the curve that is shaded, and fill in the missing values along the axis. Percentage of total area shaded: (Choose one) X 5 ? 68% 95% 99.7% 55 60 65 70 75 80 85 90 Test score
Step by Step Solution
There are 3 Steps involved in it

Get step-by-step solutions from verified subject matter experts