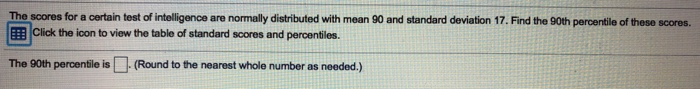
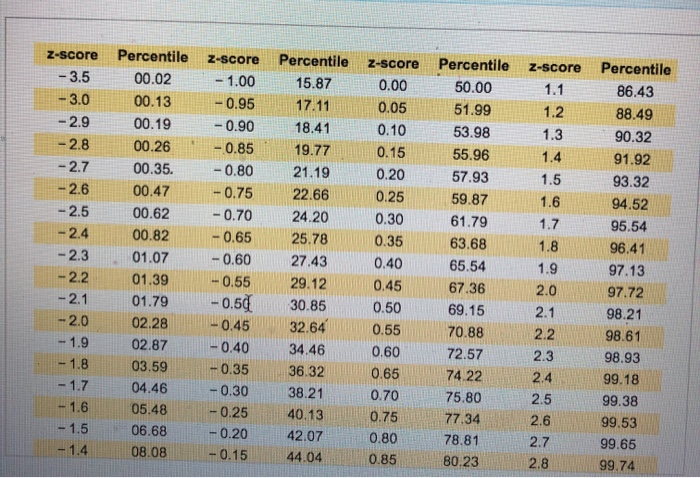
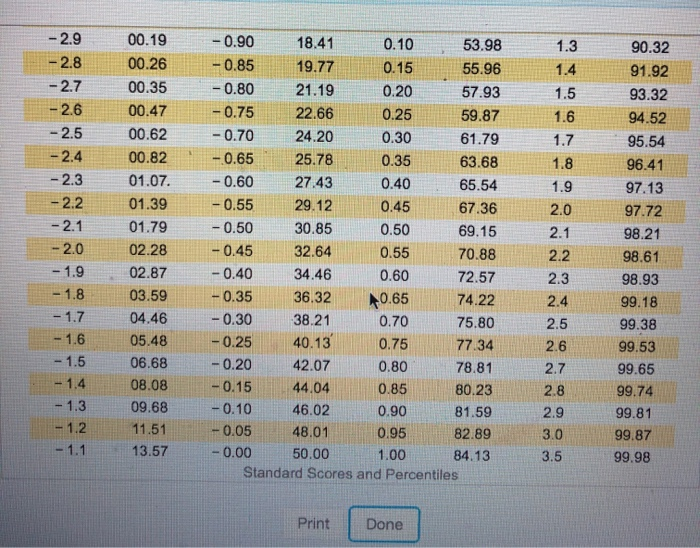
The scores for a certain test of intelligence are normally distributed with mean 90 and standard...
Fantastic news! We've Found the answer you've been seeking!
Question:
Transcribed Image Text:
The scores for a certain test of intelligence are normally distributed with mean 90 and standard deviation 17. Find the 90th percentile of these scores. the icon to view the table of standard scores and percentiles. Click The 90th percentile is. (Round to the nearest whole number as needed.) Z-score Percentile -3.5 -3.0 -2.9 -2.8 -2.7 -2.6 -2.5 -2.4 -2.3 -2.2 -2.1 -2.0 1.9 -1.8 -1.7 1.6 - 1.5 -1.4 00.02 00.13 00.19 00.26 00.35. 00.47 00.62 00.82 01.07 01.39 01.79 02.28 02.87 03.59 04.46 05.48 06.68 08.08 z-score - 1.00 -0.95 -0.90 0.85 -0.80 -0.75 -0.70 -0.65 -0.60 -0.55 -0.50 -0.45 -0.40 -0.35 -0.30 -0.25 -0.20 -0.15 Percentile Z-score Percentile z-score 15.87 0.00 50.00 1.1 17.11 0.05 51.99 1.2 18.41 0.10 53.98 1.3 19.77 0.15 55.96 1.4 21.19 0.20 57.93 1.5 22.66 0.25 59.87 1.6 24.20 0.30 61.79 1.7 25.78 0.35 63.68 1.8 27.43 0.40 65.54 1.9 29.12 0.45 67.36 2.0 30.85 0.50 69.15 2.1 32.64 0.55 70.88 2.2 34.46 0.60 72.57 2.3 36.32 0.65 74.22 2.4 38.21 0.70 75.80 2.5 40.13 0.75 77.34 2.6 42.07 0.80 78.81 2.7 44.04 0.85 80.23 2.8 Percentile 86.43 88.49 90.32 91.92 93.32 94.52 95.54 96.41 97.13 97.72 98.21 98.61 98.93 99.18 99.38 99.53 99.65 99.74 -2.9 -2.8 -2.7 -2.6 -2.5 -2.4 -2.3 -2.2 -2.1 -2.0 -1.9 -1.8 -1.7 1.6 -1.5 -1.4 -1.3 -1.2 -1.1 00.19 00.26 00.35 00.47 00.62 00.82 01.07. 01.39 01.79 02.28 02.87 03.59 04.46 05.48 06.68 08.08 09.68 11.51 13.57 - 0.90 - 0.85 -0.80 -0.75 -0.70 -0.65 -0.60 -0.55 -0.50 -0.45 -0.40 -0.35 -0.30 -0.25 -0.20 -0.15 -0.10 -0.05 -0.00 18.41 19.77 21.19 22.66 24.20 25.78 27.43 29.12 0.10 0.15 0.20 0.25 0.30 0.35 Print 0.40 0.45 0.50 0.55 0.60 0.65 0.70 0.75 0.80 0.85 0.90 0.95 1.00 30.85 32.64 34.46 36.32 38.21 40.13 42.07 44.04 46.02 48.01 50.00 Standard Scores and Percentiles 53.98 55.96 57.93 59.87 61.79 63.68 65.54 67.36 69.15 70.88 72.57 74.22 75.80 77.34 78.81 80.23 81.59 82.89 84.13 Done 1.3 1.4 1.5 1.6 1.7 1.8 1.9 2.0 2.1 2.2 2.3 2.4 2.5 2.6 2.7 2.8 2.9 3.0 3.5 90.32 91.92 93.32 94.52 95.54 96.41 97.13 97.72 98.21 98.61 98.93 99.18 99.38 99.53 99.65 99.74 99.81 99.87 99.98 The scores for a certain test of intelligence are normally distributed with mean 90 and standard deviation 17. Find the 90th percentile of these scores. the icon to view the table of standard scores and percentiles. Click The 90th percentile is. (Round to the nearest whole number as needed.) Z-score Percentile -3.5 -3.0 -2.9 -2.8 -2.7 -2.6 -2.5 -2.4 -2.3 -2.2 -2.1 -2.0 1.9 -1.8 -1.7 1.6 - 1.5 -1.4 00.02 00.13 00.19 00.26 00.35. 00.47 00.62 00.82 01.07 01.39 01.79 02.28 02.87 03.59 04.46 05.48 06.68 08.08 z-score - 1.00 -0.95 -0.90 0.85 -0.80 -0.75 -0.70 -0.65 -0.60 -0.55 -0.50 -0.45 -0.40 -0.35 -0.30 -0.25 -0.20 -0.15 Percentile Z-score Percentile z-score 15.87 0.00 50.00 1.1 17.11 0.05 51.99 1.2 18.41 0.10 53.98 1.3 19.77 0.15 55.96 1.4 21.19 0.20 57.93 1.5 22.66 0.25 59.87 1.6 24.20 0.30 61.79 1.7 25.78 0.35 63.68 1.8 27.43 0.40 65.54 1.9 29.12 0.45 67.36 2.0 30.85 0.50 69.15 2.1 32.64 0.55 70.88 2.2 34.46 0.60 72.57 2.3 36.32 0.65 74.22 2.4 38.21 0.70 75.80 2.5 40.13 0.75 77.34 2.6 42.07 0.80 78.81 2.7 44.04 0.85 80.23 2.8 Percentile 86.43 88.49 90.32 91.92 93.32 94.52 95.54 96.41 97.13 97.72 98.21 98.61 98.93 99.18 99.38 99.53 99.65 99.74 -2.9 -2.8 -2.7 -2.6 -2.5 -2.4 -2.3 -2.2 -2.1 -2.0 -1.9 -1.8 -1.7 1.6 -1.5 -1.4 -1.3 -1.2 -1.1 00.19 00.26 00.35 00.47 00.62 00.82 01.07. 01.39 01.79 02.28 02.87 03.59 04.46 05.48 06.68 08.08 09.68 11.51 13.57 - 0.90 - 0.85 -0.80 -0.75 -0.70 -0.65 -0.60 -0.55 -0.50 -0.45 -0.40 -0.35 -0.30 -0.25 -0.20 -0.15 -0.10 -0.05 -0.00 18.41 19.77 21.19 22.66 24.20 25.78 27.43 29.12 0.10 0.15 0.20 0.25 0.30 0.35 Print 0.40 0.45 0.50 0.55 0.60 0.65 0.70 0.75 0.80 0.85 0.90 0.95 1.00 30.85 32.64 34.46 36.32 38.21 40.13 42.07 44.04 46.02 48.01 50.00 Standard Scores and Percentiles 53.98 55.96 57.93 59.87 61.79 63.68 65.54 67.36 69.15 70.88 72.57 74.22 75.80 77.34 78.81 80.23 81.59 82.89 84.13 Done 1.3 1.4 1.5 1.6 1.7 1.8 1.9 2.0 2.1 2.2 2.3 2.4 2.5 2.6 2.7 2.8 2.9 3.0 3.5 90.32 91.92 93.32 94.52 95.54 96.41 97.13 97.72 98.21 98.61 98.93 99.18 99.38 99.53 99.65 99.74 99.81 99.87 99.98
Expert Answer:
Answer rating: 100% (QA)
Consider the random variable X which represents the scores of an intelligence test ... View the full answer
Related Book For
Data Analysis and Decision Making
ISBN: 978-0538476126
4th edition
Authors: Christian Albright, Wayne Winston, Christopher Zappe
Posted Date:
Students also viewed these mathematics questions
-
The lives of refrigerators are normally distributed with mean = 14 years and standard deviation = 2.5 years. (a) Draw a normal curve with the parameters labeled. (b) Shade the region that...
-
Scores on a test are normally distributed with mean 70 and standard deviation 10. What is the probability that a student scores more than 85? Using a table or computer program that can calculate the...
-
The heights of 10-year-old males are normally distributed with mean = 55.9 inches and = 5.7 inches. (a) Draw a normal curve with the parameters labeled. (b) Shade the region that represents the...
-
John Black is considering to purchasing a land from Real Estate Ltd for $1,000,000. The terms of the agreement are, 10% down payment, and the balance is to be repaid at 20% interest for duration of...
-
What are the roots of (a) x2 6x + 8, (b) 3x2 2x 5, (c) x2 + x + 1?
-
What is the director's role in building and supporting a diverse and inclusive community? Give examples of skills that you need in order to build and support a diverse and inclusive community in your...
-
You have fit a linear regression model with three predictors to a sample of 50 observations. The total sum of squares is 150 and the regression sum of squares is 120 . The estimate of the error...
-
The following accounts are denominated in rubles as of December 31, 2017. For reporting purposes, these accounts need to be stated in U.S. dollars. For each account, indicate the exchange rate that...
-
Use the following information to determine the net income or loss of a plumber, operating as a sole trader. Cash A/C 22,000 Plumbing supplies A/C 5,000 Plumbing service revenue A/C 40,000 Wages...
-
Analyze whether counseling for weight reduction has a significant effect on reducing blood pressure? Hypertension Some common strategies for treating hypertensive patients by nonpharmacologic methods...
-
On January 1, 2018, Jordan, Inc acquired a machine for $ 1,060,000. The estimated useful life of the asset is five years. Residual value at the end of five years is estimated to be $51,000. Calculate...
-
d. You are carrying your backpack to class. The backpack is in equilibrium. Draw a diagram for only the VERTICAL forces. 11 9 Tengron e. A skydiver is descending with a nonconstant velocity. Consider...
-
These are diagrams that represent the magnitude and direction of the forces acting on an object. Using the be as free body different types of forces that you have learned about (and that are listed...
-
1. For the bolted connection shown below, determine P. that can be safely carried according to LRFD provisions. Grade 8.8 M20 bolts with standard holes are used and threads are included in the shear...
-
A ball, which we can treat as a point charge, has a charge of +Q. This ball is 50 cm away from a ball of charge-100, which is fixed in position. The +Q ball is 30 cm vertically below, and 40 cm...
-
A light source consists of four tiny bulbs (point sources) arranged in the pattern shown below. This is a "front" view looking toward the light sources from the screen. This source is placed 50 cm...
-
Windsor, Inc.'s general ledger as of March 31 of the current year includes the accounts selected below before adjusting entries have been prepared. Debit Credit supplies $3,640 prepaid insurance...
-
The slopes of the tangents at the points where the curve y = x2 - 4x intersects the X-axis is 1) 1 2) +2 3) +3 4) +4
-
The file P12_02.xlsx contains the weekly sales at a local bookstore for each of the past 25 weeks. Is this time series random? Perform a runs test and find a few autocorrelations to support your...
-
Many decision problems have the following simple structure. A decision maker has two possible decisions, 1 and 2. If decision 1 is made, a sure cost of c is incurred. If decision 2 is made, there are...
-
The probability distribution of the weekly demand for copier paper (in hundreds of reams) used in the duplicating center of a corporation is provided in the file S04_58.xlsx. Assuming that it costs...
-
Forecasting transportation demand is important for multiple purposes such as staffing, planning, and inventory control. The public transportation system in Santiago de Chile has gone through a major...
-
CRISA is an Asian market research agency that specializes in tracking consumer purchase behavior in consumer goods (both durable and nondurable). In one major research project, CRISA tracks numerous...
-
Exeter, Inc., is a catalog firm that sells products in a number of different catalogs that it owns. The catalogs number in the dozens but fall into nine basic categories: 1. Clothing 2. Housewares 3....
Study smarter with the SolutionInn App