

Question: The screen shot is the problem presented. What goes inside the blanks? Simon Company's year-end balance sheets follow. At December 31 Current Yr 1 Yr
The screen shot is the problem presented. What goes inside the blanks?
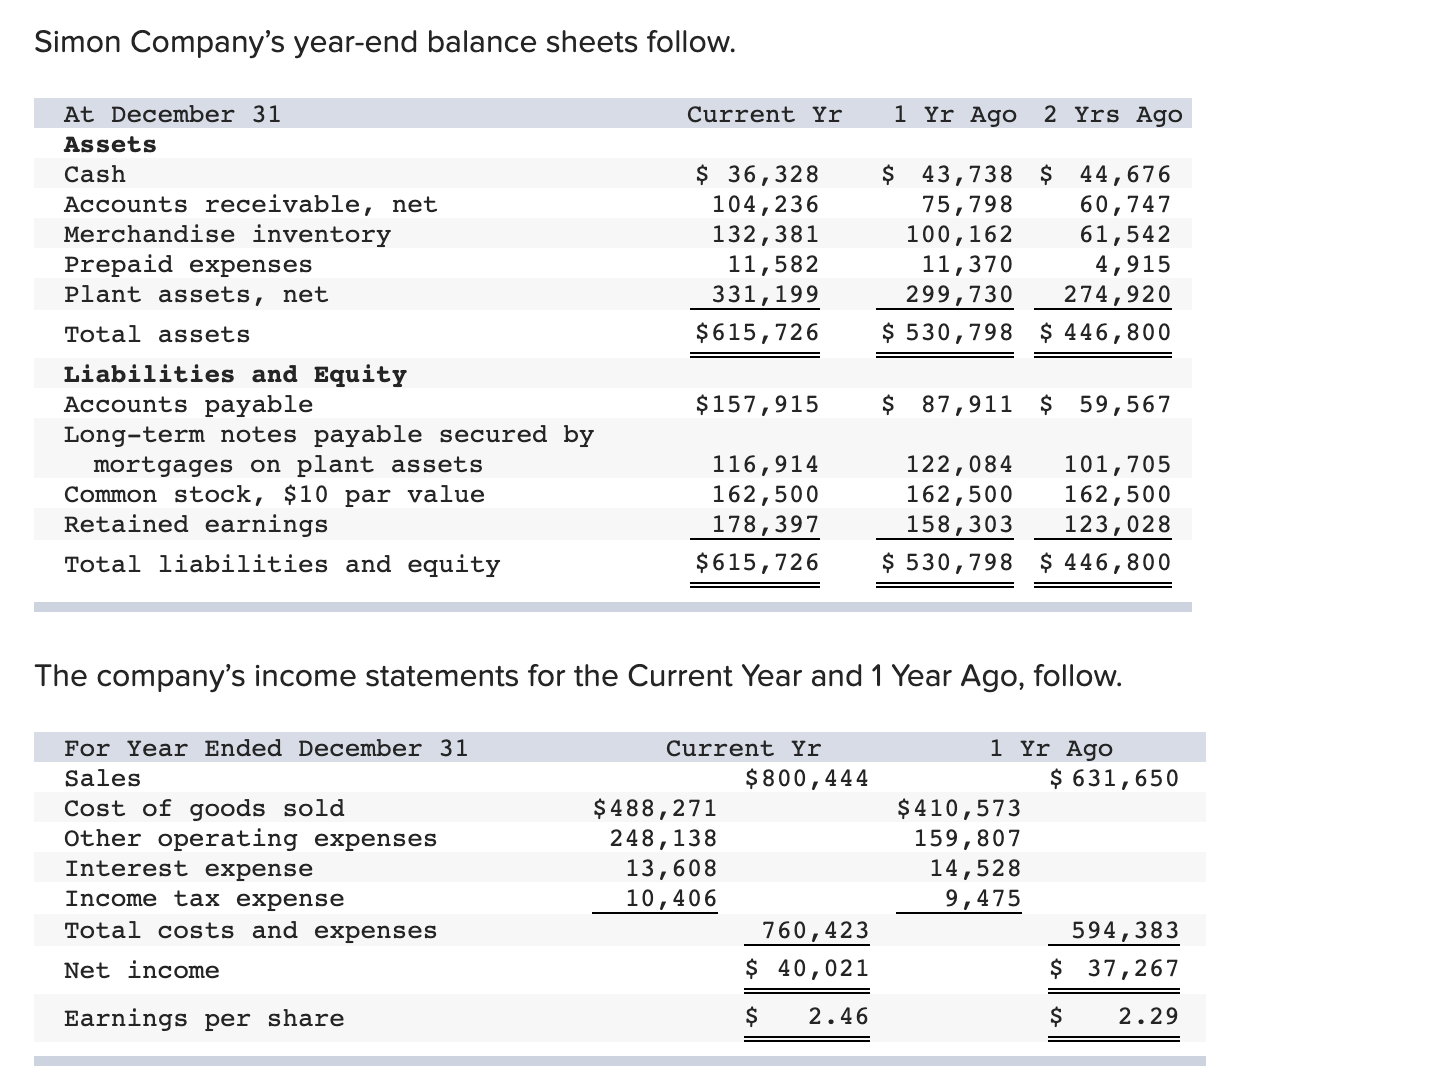
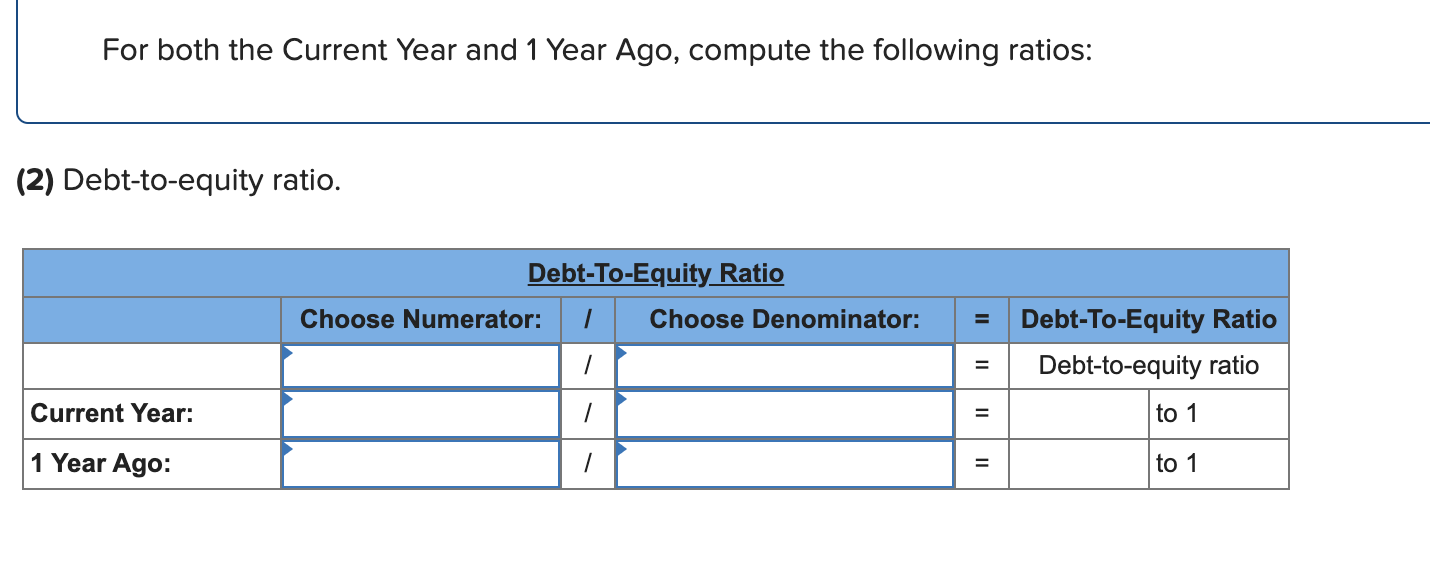
Simon Company's year-end balance sheets follow. At December 31 Current Yr 1 Yr Ago 2 Yrs Ago Assats Cash $ 36,328 $ 43,738 $ 44,676 Accounts receivable, net 104,236 75,798 60,747 Merchandise inventory 132,381 100,162 61,542 Prepaid expenses 11,582 11,370 4,915 Plant assets, net 331,199 299,730 274,920 Total assets $615,726 $ 530,798 $ 446,800 Liabilities and Equity Accounts payable $157,915 $ 87,911 $ 59,567 Long-term notes payable secured by mortgages on plant assets 116,914 122,084 101,705 Common stock, $10 par value 162,500 162,500 162,500 Retained earnings 178,397 158,303 123,028 Total liabilities and equity $615,726 $530,798 $446,800 The company's income statements for the Current Year and 1 Year Ago, follow. For Year Ended December 31 Current Yr 1 Yr Ago Sales $800,444 $631,650 Cost of goods sold $488,271 $410,573 Other operating expenses 248,138 159,807 Interest expense 13,608 14,528 Income tax expense 10,406 9,475 Total costs and expenses 760,423 594,383 Net income 5 40,021 $ 37,267 Earnings per share $ 2.46 $ 2.29 For both the Current Year and 1 Year Ago, compute the following ratios: (2) Debt-to-equity ratio. Debt-To-Equity Ratio Choose Numerator: - Choose Denominator: Debt-To-Equity Ratio Debt-to-equity ratio Current Year: S to 1 1 Year Ago: to 1
Step by Step Solution
There are 3 Steps involved in it

Get step-by-step solutions from verified subject matter experts