

Question: The search algorithms you have learnt in CS-331 can be used to traverse the graph shown in Fig 1.1. As you may already know, traversal
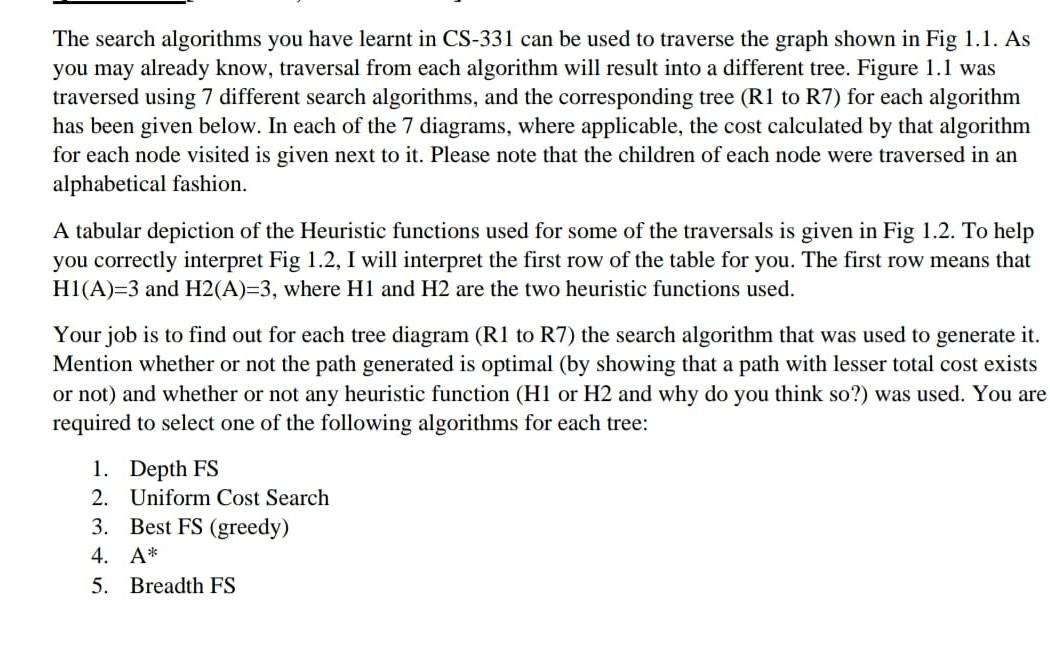
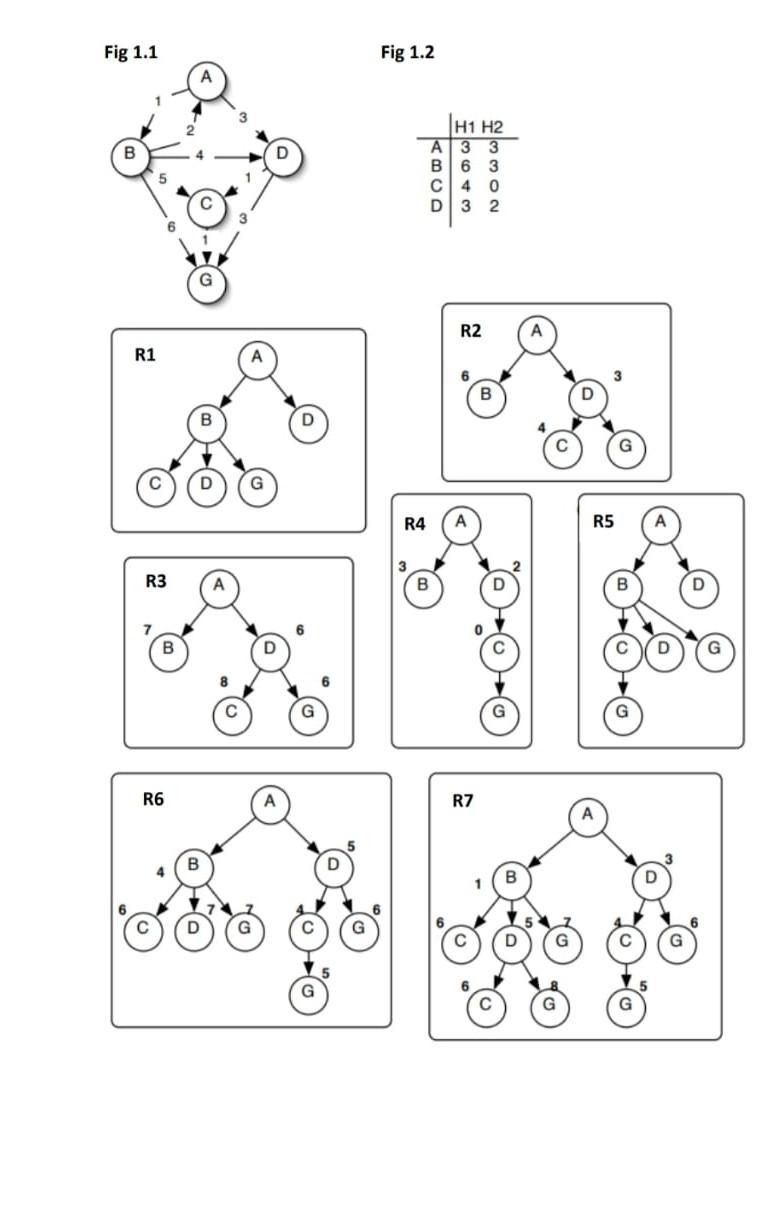
The search algorithms you have learnt in CS-331 can be used to traverse the graph shown in Fig 1.1. As you may already know, traversal from each algorithm will result into a different tree. Figure 1.1 was traversed using 7 different search algorithms, and the corresponding tree (R1 to R7) for each algorithm has been given below. In each of the 7 diagrams, where applicable, the cost calculated by that algorithm for each node visited is given next to it. Please note that the children of each node were traversed in an alphabetical fashion. A tabular depiction of the Heuristic functions used for some of the traversals is given in Fig 1.2. To help you correctly interpret Fig 1.2, I will interpret the first row of the table for you. The first row means that H1(A)=3 and H2(A)=3, where H1 and H2 are the two heuristic functions used. Your job is to find out for each tree diagram (R1 to R7) the search algorithm that was used to generate it. Mention whether or not the path generated is optimal (by showing that a path with lesser total cost exists or not) and whether or not any heuristic function (H1 or H2 and why do you think so?) was used. You are required to select one of the following algorithms for each tree: 1. Depth FS 2. Uniform Cost Search 3. Best FS (greedy) 4. A* 5. Breadth FS Fig 1.1 Fig 1.2 H1 H2 A 33 B 6 3 C4 0 D 3 2 R2 A R1 B R4 A R5 R3 B 7 B R6 RZ B o The search algorithms you have learnt in CS-331 can be used to traverse the graph shown in Fig 1.1. As you may already know, traversal from each algorithm will result into a different tree. Figure 1.1 was traversed using 7 different search algorithms, and the corresponding tree (R1 to R7) for each algorithm has been given below. In each of the 7 diagrams, where applicable, the cost calculated by that algorithm for each node visited is given next to it. Please note that the children of each node were traversed in an alphabetical fashion. A tabular depiction of the Heuristic functions used for some of the traversals is given in Fig 1.2. To help you correctly interpret Fig 1.2, I will interpret the first row of the table for you. The first row means that H1(A)=3 and H2(A)=3, where H1 and H2 are the two heuristic functions used. Your job is to find out for each tree diagram (R1 to R7) the search algorithm that was used to generate it. Mention whether or not the path generated is optimal (by showing that a path with lesser total cost exists or not) and whether or not any heuristic function (H1 or H2 and why do you think so?) was used. You are required to select one of the following algorithms for each tree: 1. Depth FS 2. Uniform Cost Search 3. Best FS (greedy) 4. A* 5. Breadth FS Fig 1.1 Fig 1.2 H1 H2 A 33 B 6 3 C4 0 D 3 2 R2 A R1 B R4 A R5 R3 B 7 B R6 RZ B o
Step by Step Solution
There are 3 Steps involved in it

Get step-by-step solutions from verified subject matter experts