Question: the second picture is the answer for part b. i was wondering how did they get that the forecast equalled 164.740 for Friday, 281.569 for

the second picture is the answer for part b. i the second picture is the answer for part b.
the second picture is the answer for part b. i 
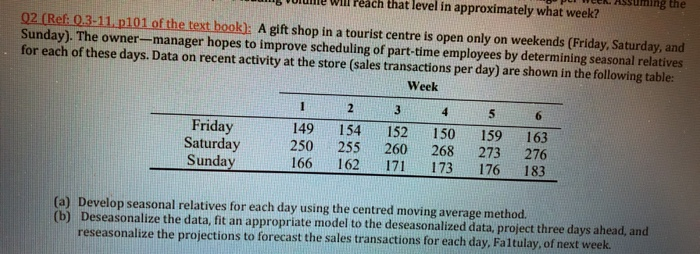
i was wondering how did they get that the forecast equalled 164.740 for Friday, 281.569 for sat and 183.333 for sun. thank you!
the second picture is the answer for part b. i
m. per week. Assuming the mg me will reach that level in approximately what week? 02 (Ref: 0.3-11. p101 of the text book): A gift shop in a tourist centre is open only on weekends (Friday, Saturday, and Sunday). The owner-manager hopes to improve scheduling of part-time employees by determining seasonal relatives for each of these days. Data on recent activity at the store (sales transactions per day) are shown in the following table: Week 3 4 5 6 Friday 149 154 152 150 159 163 Saturday 250 255 260 268 273 276 Sunday 166 162 171 173 176 183 (a) Develop seasonal relatives for each day using the centred moving average method. (b) Deseasonalize the data, fit an appropriate model to the deseasonalized data, project three days ahead, and reseasonalize the projections to forecast the sales transactions for each day, Faltulay, of next week Sales/SR V= 1.2559x + 184.73 215.000 210.000 205.000 200.000 195.000 190.000 185.000 180.000 175.000 170.000 Sales/SR Linear (Sales/SR) 1 2 3 4 5 6 7 8 9 10 11 12 13 14 15 16 17 18 19 20 21 Fri Sat Sun Trend fest 208.592 209.848 211.104 forecast 164.740 281.569 183.333 Week Day Fri Sat Sun Fri Sat Sun Fri Sat Sun Fri Sat Sun Fri Sat Sales 149 250 166 154 255 162 152 260 171 150 268 173 159 273 SR 0.790 1.342 0.868 0.790 1.342 0.868 0.790 1.342 0.868 0.790 1.342 0.868 0.790 1.342 0.868 0.790 1.342 0.868 Sales/SR 188.662 186.320 191.145 194.993 190.047 186.539 192.461 193.773 196.902 189.928 199.735 199. 205 201.324 203.462 202.660 206.389 205.697 210.720 Sun 176 Fri Sat Sun 163 276 183 Week Day CMAZ Sales/CMA, Fri Sat Sales 149 250 166 154 255 Sun Fri Sat Sun Fri 162 Sat 152 260 171 150 268 173 188.3 190.0 191.7 190.3 189.7 191.3 194.3 193.7 196.3 197.0 200.0 201.7 202.7 204.0 205.0 207.3 1.327 0.874 0.803 1.340 0.854 0.794 1.338 0.883 0.764 1.360 0.865 0.788 1.347 0.863 0.795 1.331 Fri 159 Sat Sun Fri 176 163 276 183 Sat Sun Fri Sat Week 1 Week 2 Week 3 Week 4 Week 5 Week 6 avg adjusted 0.803 0.794 0.764 0.788 0.795 0.789 0.790 Sun 1.327 1.340 1.338 1.360 1.347 1.331 1.341 .342 0.874 0.854) 0.883 0.865 0.863 sum 0.868 0.868 2.997 3.000 1 22

Step by Step Solution

There are 3 Steps involved in it

1 Expert Approved Answer
Step: 1 Unlock blur-text-image
Question Has Been Solved by an Expert!

Get step-by-step solutions from verified subject matter experts

Step: 2 Unlock
Step: 3 Unlock

Students Have Also Explored These Related General Management Questions!