

Question: The second question is 3 decimal places 1. [-/4 Points] DETAILS LCALCCON5 4.4.001. MY NOTES ASK YOUR TEACHER The figure shows an estimate of the
![The second question is 3 decimal places 1. [-/4 Points] DETAILS](https://s3.amazonaws.com/si.experts.images/answers/2024/06/6674d2b935a52_1536674d2b90d41b.jpg)
The second question is 3 decimal places
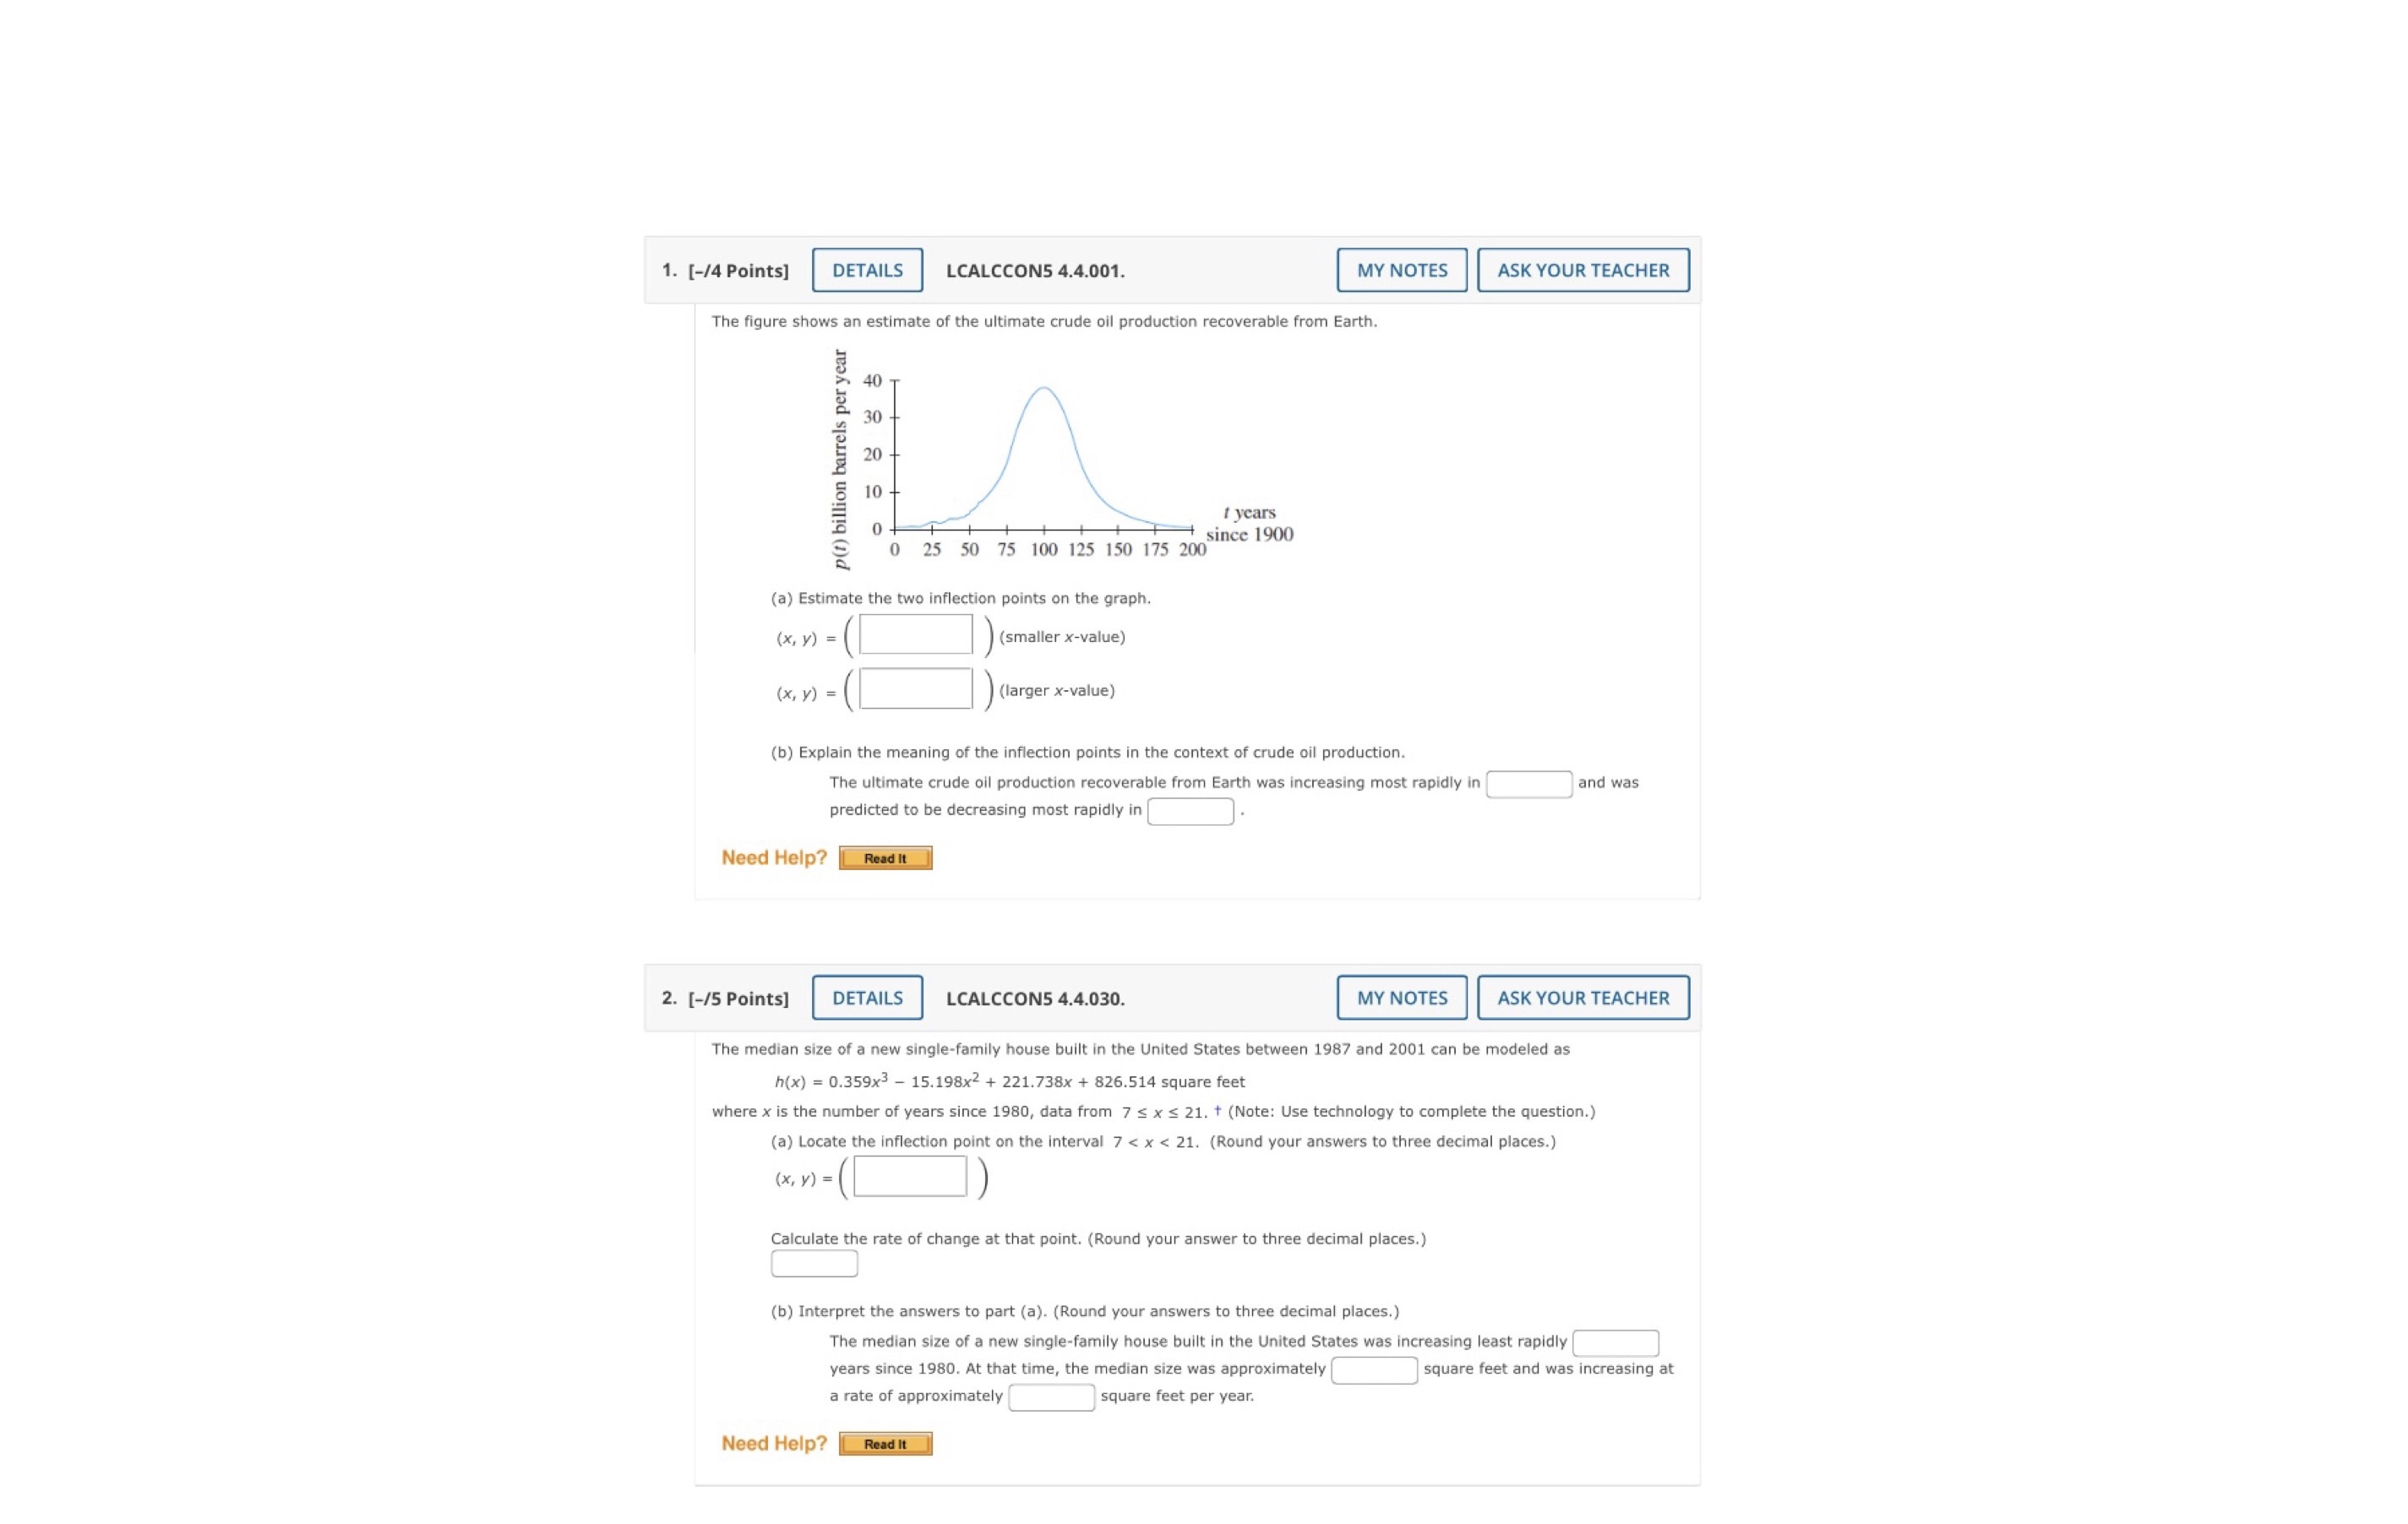
1. [-/4 Points] DETAILS LCALCCON5 4.4.001. MY NOTES ASK YOUR TEACHER The figure shows an estimate of the ultimate crude oil production recoverable from Earth. 40 30 p(1) billion barrels per year 10 - of 1 years 0 25 50 75 100 125 150 175 200 since 1900 (a) Estimate the two inflection points on the graph. ( x, v ) = ( (smaller x-value) (x, y ) = ( ( larger x-value) (b) Explain the meaning of the inflection points in the context of crude oil production. The ultimate crude oil production recoverable from Earth was increasing most rapidly in and was predicted to be decreasing most rapidly in Need Help? Read It 2. [-/5 Points] DETAILS LCALCCON5 4.4.030. MY NOTES ASK YOUR TEACHER The median size of a new single-family house built in the United States between 1987 and 2001 can be modeled as h(x) = 0.359x3 - 15.198x2 + 221.738x + 826.514 square feet where x is the number of years since 1980, data from 7 s x S 21. + (Note: Use technology to complete the question.) (a) Locate the inflection point on the interval 7
Step by Step Solution
There are 3 Steps involved in it

Get step-by-step solutions from verified subject matter experts