

Question: The security market line (SML) shows the relationship between beta and expected return. The following graph shows stocks' betas () and expected returns (): Assume
The security market line (SML) shows the relationship between beta and expected return.
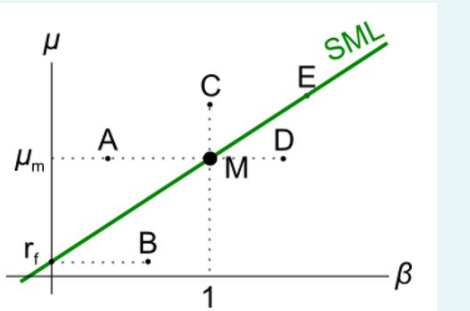
The following graph shows stocks' betas () and expected returns ():
Assume that the CAPM holds and expectations of stocks' returns and betas are correctly measured.
Which statement is NOT correct?
a.
The price of Stock B will fall, and the excess return of Stock B will rise.
b.
Rational investors should sell Stock D.
c.
Stock C has the same systematic risk as the market portfolio.
d.
Stock E is fairly priced.
e.
Stock A has a negative excess return (a negative alpha).
SML E A A D Mm E M B B 1
Step by Step Solution
There are 3 Steps involved in it
1 Expert Approved Answer
Step: 1 Unlock

Question Has Been Solved by an Expert!
Get step-by-step solutions from verified subject matter experts
Step: 2 Unlock
Step: 3 Unlock