

Question: . The side-by-side boxplot below shows two boxplots for quantitative response infor- mation collected from two groups of individuals. (a)Can you tell from the boxplots
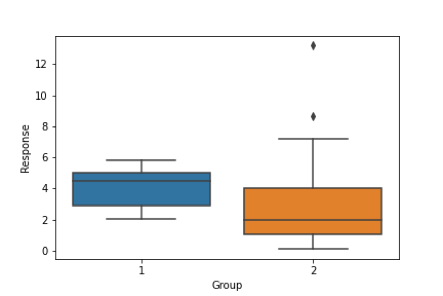
. The side-by-side boxplot below shows two boxplots for quantitative response infor- mation collected from two groups of individuals.
- (a)Can you tell from the boxplots how many individuals were in the two groups, respectively? If you can tell, describe how you can tell. If you can't tell, explain why not.
- (b)Approximately what percentage of individuals in group 2 has response values of less than 2?
- (c)What, approximately, was the largest response received from individuals in group 1?
- (d)For which group is the distribution of response values more symmetric? Explain how you reach your decision.
Step by Step Solution
There are 3 Steps involved in it
1 Expert Approved Answer
Step: 1 Unlock

Question Has Been Solved by an Expert!
Get step-by-step solutions from verified subject matter experts
Step: 2 Unlock
Step: 3 Unlock