

Question: The sieve analysis result for a soil sample is shown in the table below. Atterberg tests resulted in L L = 3 0 and P
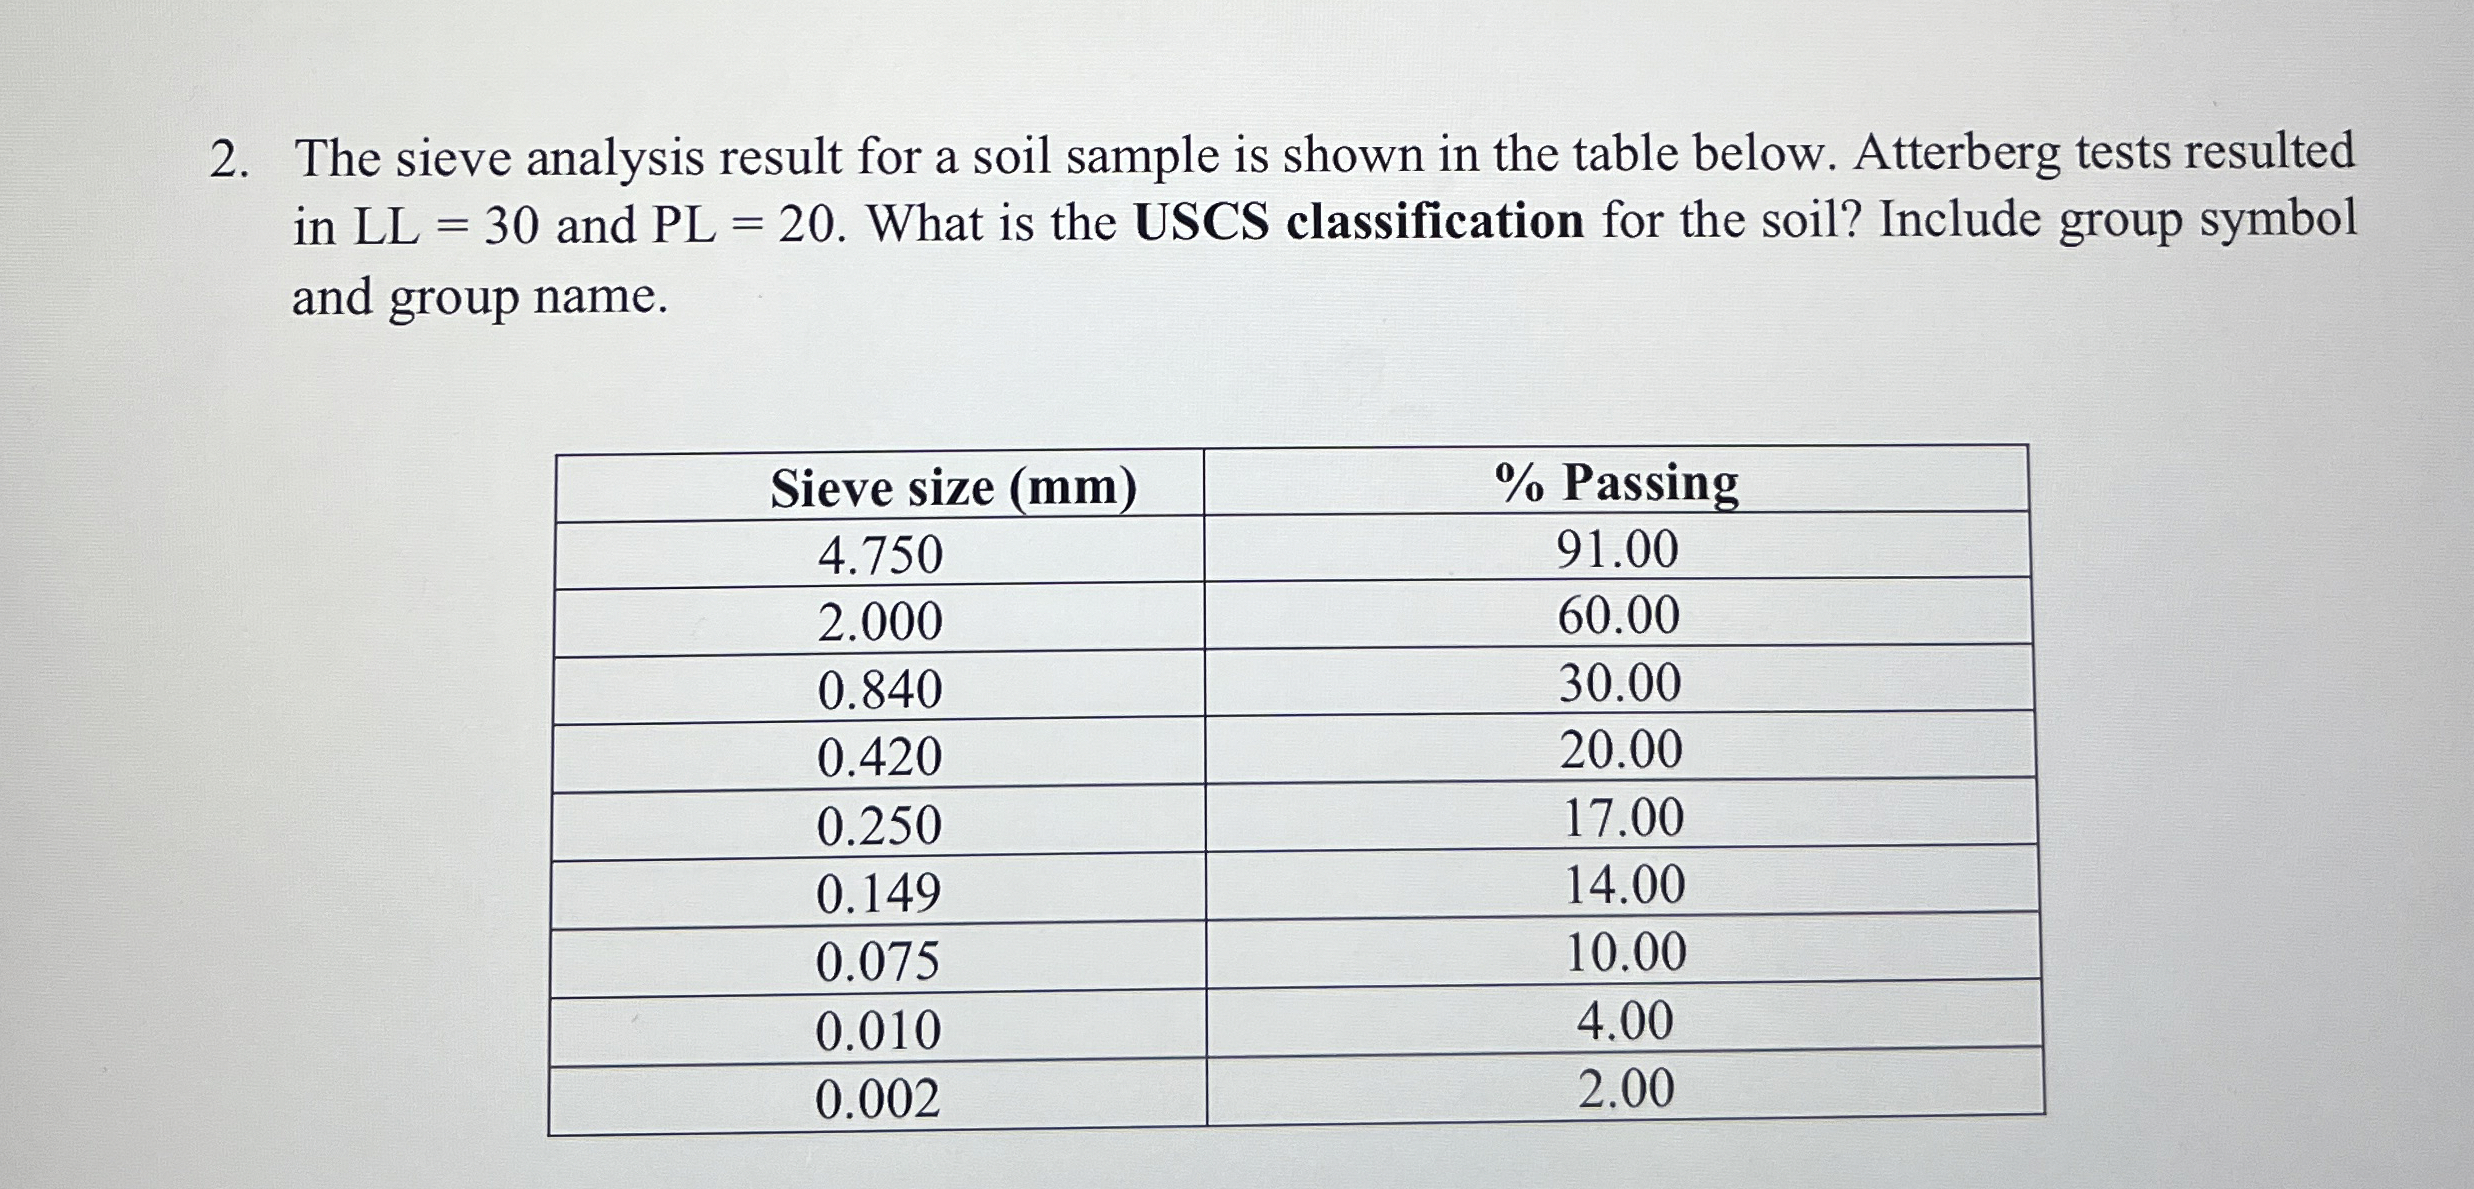
The sieve analysis result for a soil sample is shown in the table below. Atterberg tests resulted in and What is the USCS classification for the soil? Include group symbol
and group name.
tableSieve size mm Passing
Step by Step Solution
There are 3 Steps involved in it
1 Expert Approved Answer
Step: 1 Unlock

Question Has Been Solved by an Expert!
Get step-by-step solutions from verified subject matter experts
Step: 2 Unlock
Step: 3 Unlock