

The signals with the frequency spectra shown in Figure P5.25(a) and (b) are sampled by the use
Fantastic news! We've Found the answer you've been seeking!
Question:
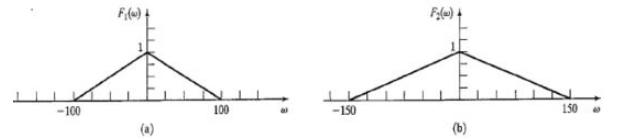
The signals with the frequency spectra shown in Figure P5.25(a) and (b) are sampled by the use of an ideal sampler with ωs = 200 rad/s.
(a) Sketch the frequency spectra of the sampled signals.
(b) Compare and discuss the results of part (a).
Expert Answer:

Related Book For 

Posted Date:
