

The single line diagram (SLD) of a system is shown in Figure 1. At bus B, there
Fantastic news! We've Found the answer you've been seeking!
Question:
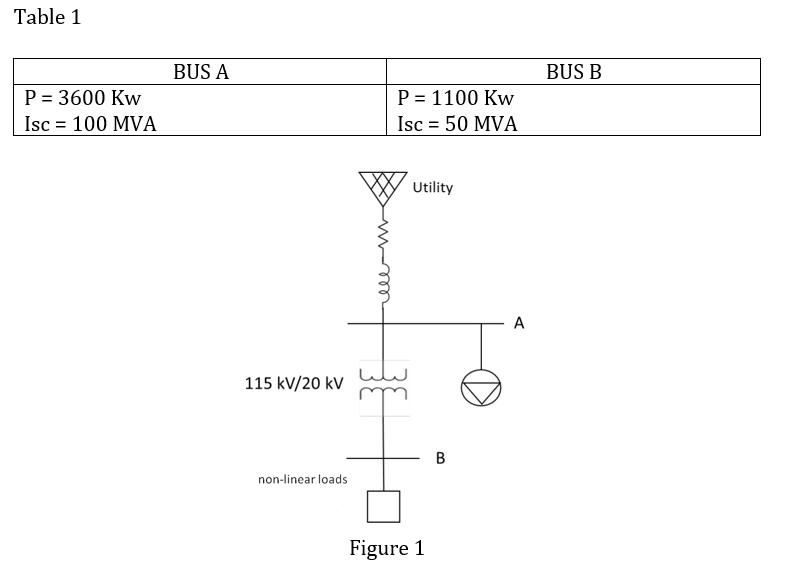
The single line diagram (SLD) of a system is shown in Figure 1. At bus B, there is a non-linear load that acts as a source of harmonics in the system.
- Using the data in Table 1 and the conditions in Figure 1, evaluate the TDD value of the system based on IEEE 519-2014 standard! Assume the factor is 0.9 and the 5th, 7th, 11th order current harmonics at Bus A and B are the same. Current harmonics of order 5, 7 and 11 are 3 A, 1 A and 0.5 A respectively.
- Based on the results obtained in point 1), does the system need mitigation? related to harmonic countermeasures? Explain!
Expert Answer:
The TDD value of the system can be evaluated by using the IEEE 5192014 standard ... View the full answer

Related Book For 

Posted Date:
