

Question: The Solow-Swan Model with Endogenous Capital In the basic Solow-Swan model, technological progress is assumed exogenous. Let's consider the impact on the model's prediction if
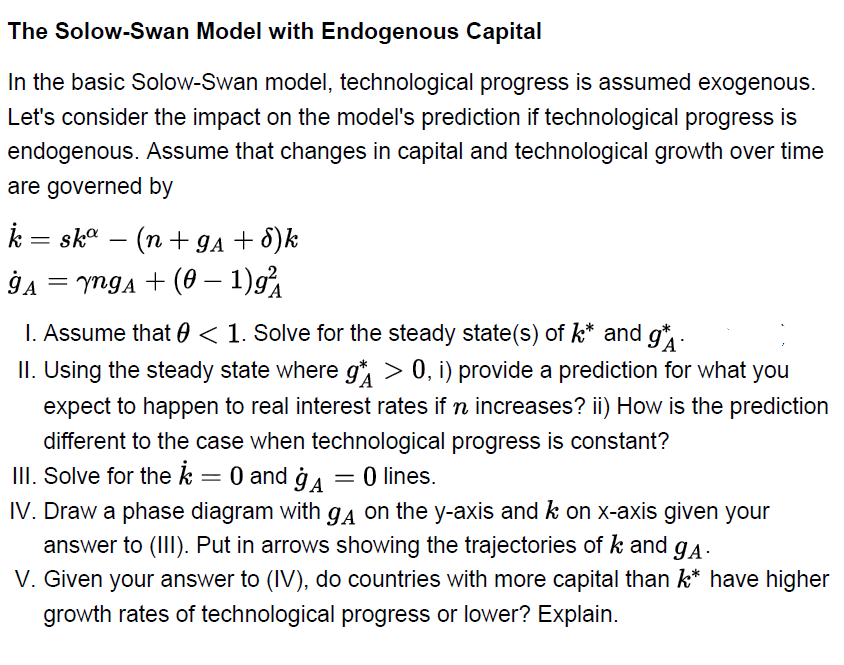
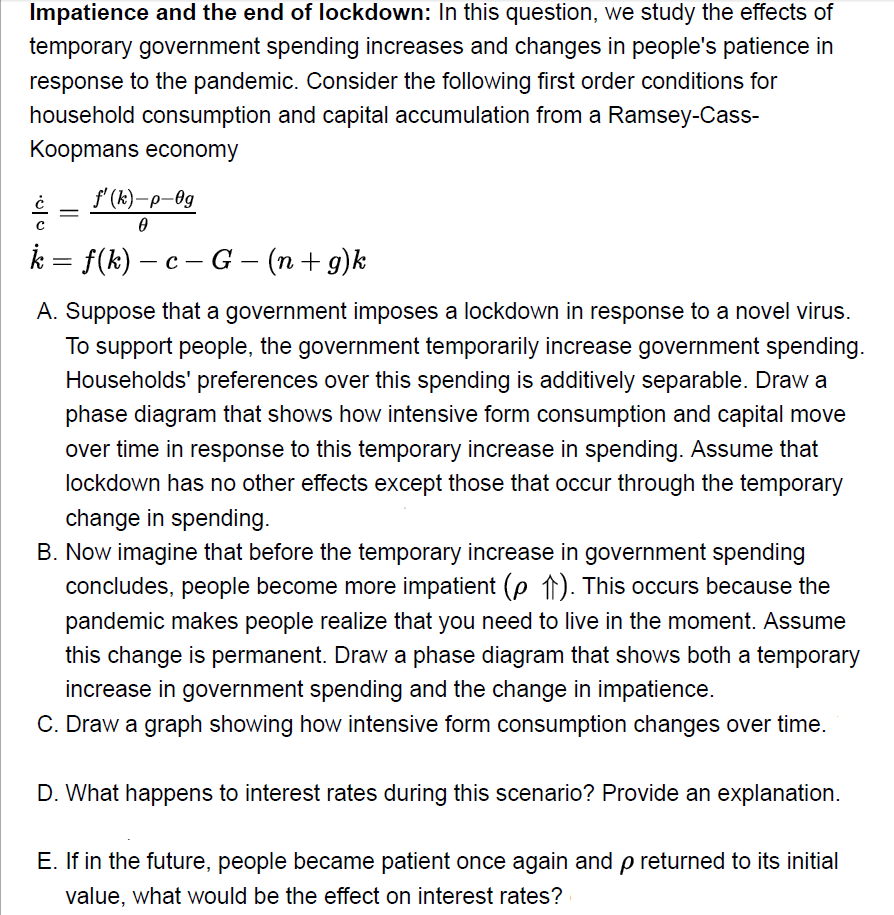
The Solow-Swan Model with Endogenous Capital In the basic Solow-Swan model, technological progress is assumed exogenous. Let's consider the impact on the model's prediction if technological progress is endogenous. Assume that changes in capital and technological growth over time are governed by k=sk(n+gA+)kgA=ngA+(1)gA2 I. Assume that 0, i) provide a prediction for what you expect to happen to real interest rates if n increases? ii) How is the prediction different to the case when technological progress is constant? III. Solve for the k=0 and gA=0 lines. IV. Draw a phase diagram with gA on the y-axis and k on x-axis given your answer to (III). Put in arrows showing the trajectories of k and gA. V. Given your answer to (IV), do countries with more capital than k have higher growth rates of technological progress or lower? Explain. Impatience and the end of lockdown: In this question, we study the effects of temporary government spending increases and changes in people's patience in response to the pandemic. Consider the following first order conditions for household consumption and capital accumulation from a Ramsey-CassKoopmans economy cc=f(k)gk=f(k)cG(n+g)k A. Suppose that a government imposes a lockdown in response to a novel virus. To support people, the government temporarily increase government spending. Households' preferences over this spending is additively separable. Draw a phase diagram that shows how intensive form consumption and capital move over time in response to this temporary increase in spending. Assume that lockdown has no other effects except those that occur through the temporary change in spending. B. Now imagine that before the temporary increase in government spending concludes, people become more impatient (). This occurs because the pandemic makes people realize that you need to live in the moment. Assume this change is permanent. Draw a phase diagram that shows both a temporary increase in government spending and the change in impatience. C. Draw a graph showing how intensive form consumption changes over time. D. What happens to interest rates during this scenario? Provide an explanation. E. If in the future, people became patient once again and returned to its initial value, what would be the effect on interest rates? The Solow-Swan Model with Endogenous Capital In the basic Solow-Swan model, technological progress is assumed exogenous. Let's consider the impact on the model's prediction if technological progress is endogenous. Assume that changes in capital and technological growth over time are governed by k=sk(n+gA+)kgA=ngA+(1)gA2 I. Assume that 0, i) provide a prediction for what you expect to happen to real interest rates if n increases? ii) How is the prediction different to the case when technological progress is constant? III. Solve for the k=0 and gA=0 lines. IV. Draw a phase diagram with gA on the y-axis and k on x-axis given your answer to (III). Put in arrows showing the trajectories of k and gA. V. Given your answer to (IV), do countries with more capital than k have higher growth rates of technological progress or lower? Explain. Impatience and the end of lockdown: In this question, we study the effects of temporary government spending increases and changes in people's patience in response to the pandemic. Consider the following first order conditions for household consumption and capital accumulation from a Ramsey-CassKoopmans economy cc=f(k)gk=f(k)cG(n+g)k A. Suppose that a government imposes a lockdown in response to a novel virus. To support people, the government temporarily increase government spending. Households' preferences over this spending is additively separable. Draw a phase diagram that shows how intensive form consumption and capital move over time in response to this temporary increase in spending. Assume that lockdown has no other effects except those that occur through the temporary change in spending. B. Now imagine that before the temporary increase in government spending concludes, people become more impatient (). This occurs because the pandemic makes people realize that you need to live in the moment. Assume this change is permanent. Draw a phase diagram that shows both a temporary increase in government spending and the change in impatience. C. Draw a graph showing how intensive form consumption changes over time. D. What happens to interest rates during this scenario? Provide an explanation. E. If in the future, people became patient once again and returned to its initial value, what would be the effect on interest rates
Step by Step Solution
There are 3 Steps involved in it

Get step-by-step solutions from verified subject matter experts