

Question: The solution described in problem # 2 is placed in the spectrophotometer. Based on the calibration curve shown on the next page, what would you
The solution described in problem # is placed in the spectrophotometer. Based on the calibration curve shown on the next page, what would you predict the absorbance to be Note: like the example given in the discussion, the absorbance should be calculated, not just estimated from the graph. Notice that the slope and intercept of the calibration curve are provided in the figure on the next page. Please help me find the Absorbance
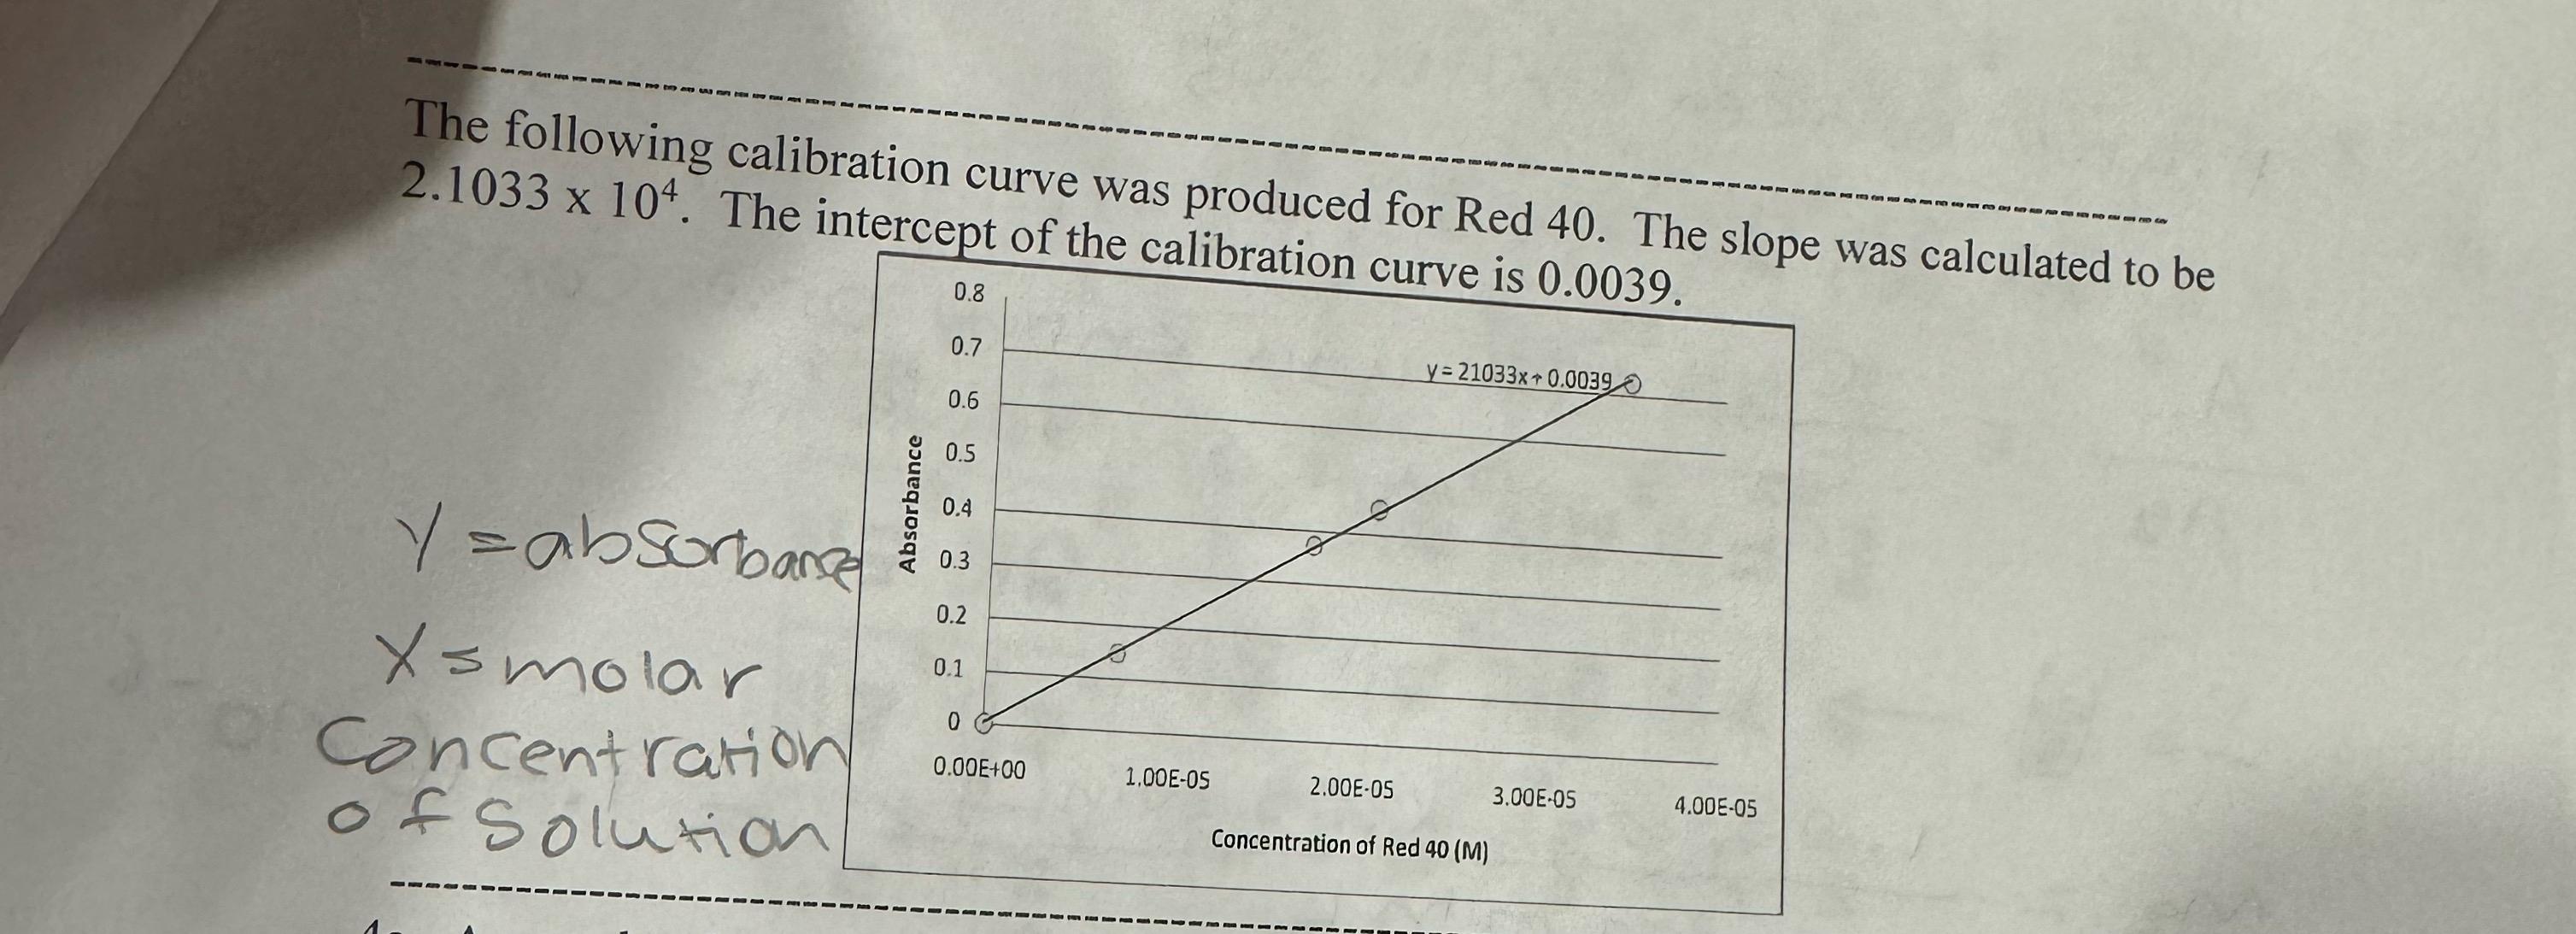
The following calibration curve was produced for Red The slope was calculated to be The intercept of the calibration curve is
Step by Step Solution
There are 3 Steps involved in it
1 Expert Approved Answer
Step: 1 Unlock

Question Has Been Solved by an Expert!
Get step-by-step solutions from verified subject matter experts
Step: 2 Unlock
Step: 3 Unlock