

Question: The solutions should be typed in Word, with clear solution procedures, explanation and discussion whenever applicable. Only present- ing results without a clear methodology will
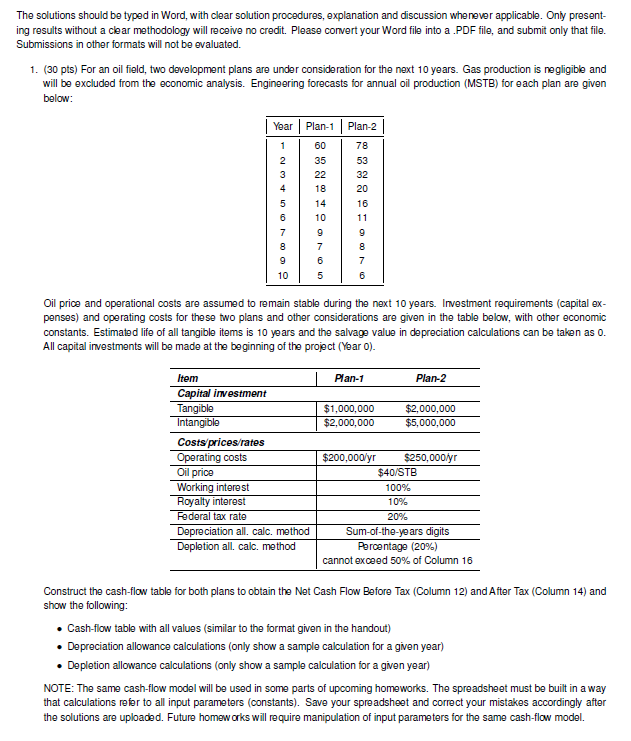
The solutions should be typed in Word, with clear solution procedures, explanation and discussion whenever applicable. Only present- ing results without a clear methodology will receive no credit. Please convert your Word file into a .PDF file, and submit only that file. Submissions in other formats will not be evaluated. 1. (30 pts) For an oil field, two development plans are under consideration for the next 10 years. Gas production is negligible and will be excluded from the economic analysis. Engineering forecasts for annual oil production (MSTB) for each plan are given below: Year Plan-1 | Plan-2 1 2 3 60 35 22 18 14 10 9 78 53 32 20 16 11 4 5 6 7 6 5 7 6 10 Oil price and operational costs are assumed to remain stable during the next 10 years. Investment requirements (capital ex- penses) and operating costs for these two plans and other considerations are given in the table below, with other economic constants. Estimated life of all tangible items is 10 years and the salvage value in depreciation calculations can be taken as o. All capital investments will be made at the beginning of the project (Year O). Plan-1 Plan-2 Item Capital investment Tangible Intangiblo Costs prices/rates Operating costs $1,000,000 $2,000,000 $2,000,000 $5,000,000 Oil price Working interest Royalty interest Federal tax rate Depreciation all, calc. method Depletion all, calc. method $200,000/yr $250,000/yr $40/STB 100% 10% 20% Sum-of-the-years digits Percentage (20%) cannot exceed 50% of Column 16 Construct the cash-flow table for both plans to obtain the Net Cash Flow Before Tax (Column 12) and After Tax (Column 14) and show the following: Cash-flow table with all values (similar to the format given in the handout) Depreciation allowance calculations (only show a sample calculation for a given year) Depletion allowance calculations (only show a sample calculation for a given year) NOTE: The same cash-flow model will be used in some parts of upcoming homeworks. The spreadsheet must be built in a way that calculations refer to all input parameters (constants). Save your spreadsheet and correct your mistakes accordingly after the solutions are uploaded. Future homeworks will require manipulation of input parameters for the same cash-flow model. The solutions should be typed in Word, with clear solution procedures, explanation and discussion whenever applicable. Only present- ing results without a clear methodology will receive no credit. Please convert your Word file into a .PDF file, and submit only that file. Submissions in other formats will not be evaluated. 1. (30 pts) For an oil field, two development plans are under consideration for the next 10 years. Gas production is negligible and will be excluded from the economic analysis. Engineering forecasts for annual oil production (MSTB) for each plan are given below: Year Plan-1 | Plan-2 1 2 3 60 35 22 18 14 10 9 78 53 32 20 16 11 4 5 6 7 6 5 7 6 10 Oil price and operational costs are assumed to remain stable during the next 10 years. Investment requirements (capital ex- penses) and operating costs for these two plans and other considerations are given in the table below, with other economic constants. Estimated life of all tangible items is 10 years and the salvage value in depreciation calculations can be taken as o. All capital investments will be made at the beginning of the project (Year O). Plan-1 Plan-2 Item Capital investment Tangible Intangiblo Costs prices/rates Operating costs $1,000,000 $2,000,000 $2,000,000 $5,000,000 Oil price Working interest Royalty interest Federal tax rate Depreciation all, calc. method Depletion all, calc. method $200,000/yr $250,000/yr $40/STB 100% 10% 20% Sum-of-the-years digits Percentage (20%) cannot exceed 50% of Column 16 Construct the cash-flow table for both plans to obtain the Net Cash Flow Before Tax (Column 12) and After Tax (Column 14) and show the following: Cash-flow table with all values (similar to the format given in the handout) Depreciation allowance calculations (only show a sample calculation for a given year) Depletion allowance calculations (only show a sample calculation for a given year) NOTE: The same cash-flow model will be used in some parts of upcoming homeworks. The spreadsheet must be built in a way that calculations refer to all input parameters (constants). Save your spreadsheet and correct your mistakes accordingly after the solutions are uploaded. Future homeworks will require manipulation of input parameters for the same cash-flow model
Step by Step Solution
There are 3 Steps involved in it

Get step-by-step solutions from verified subject matter experts