

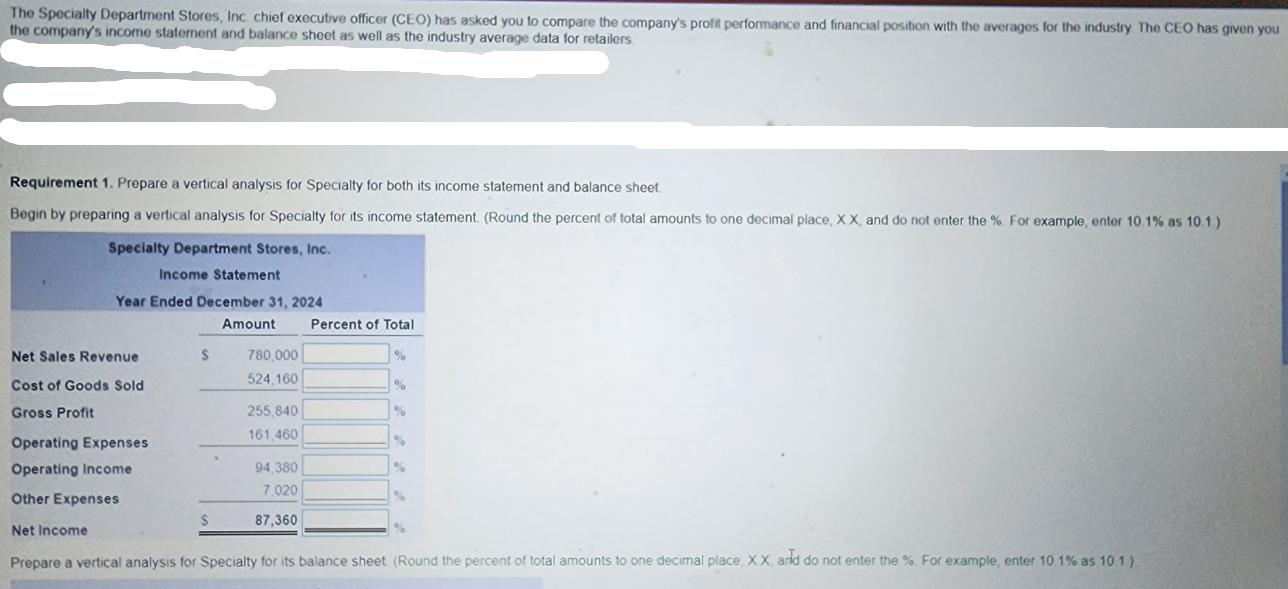
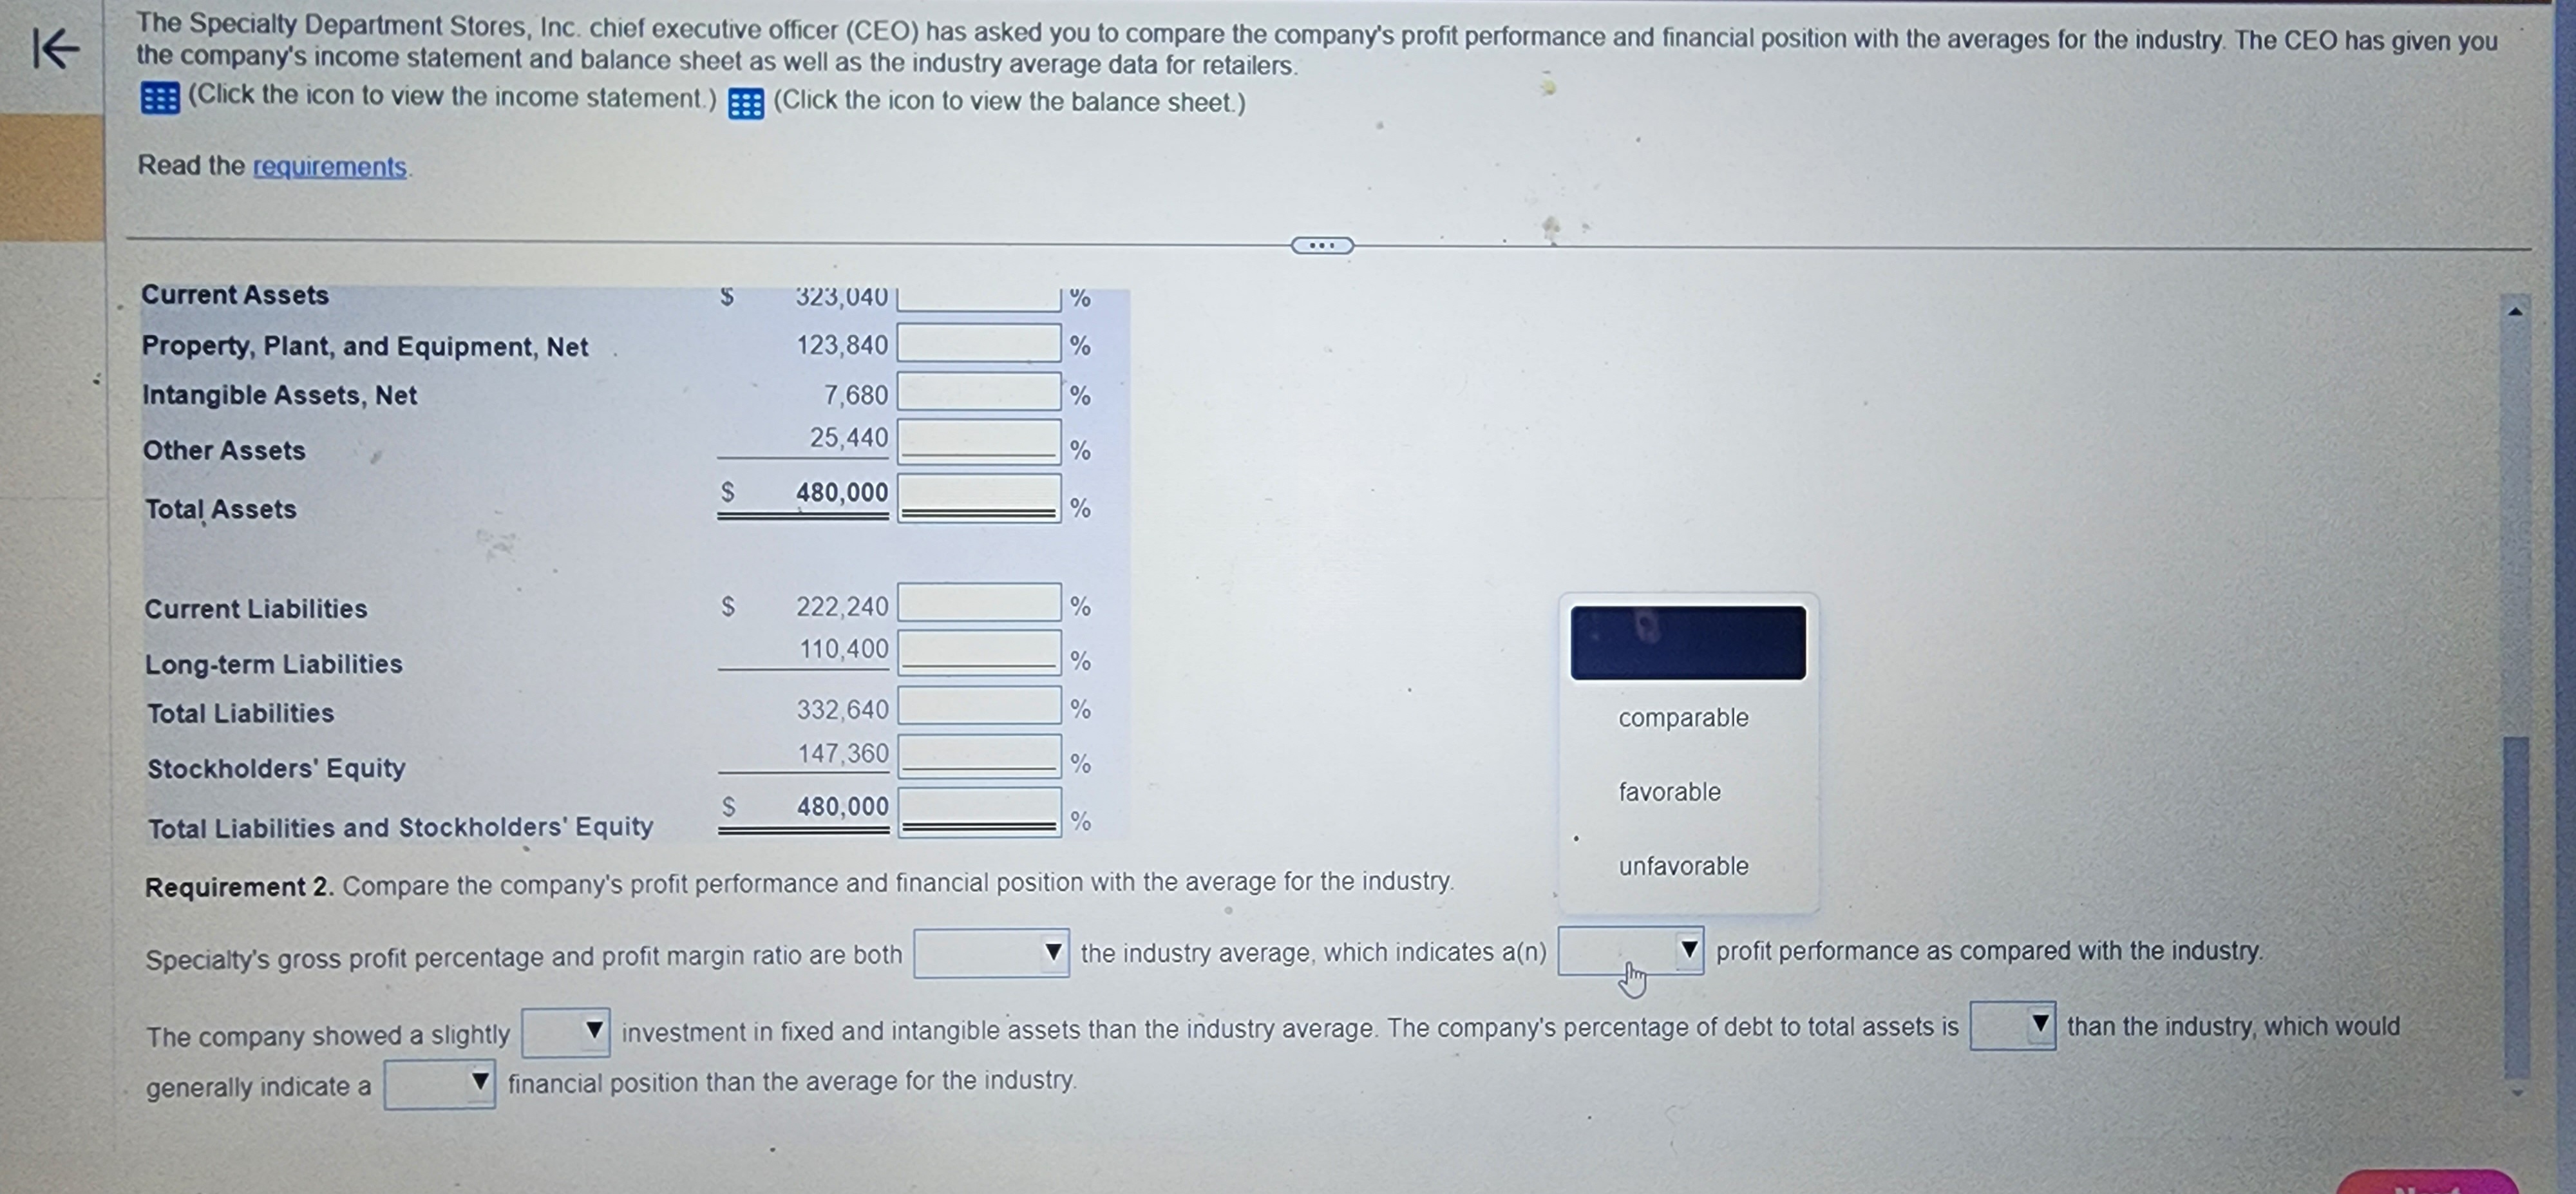
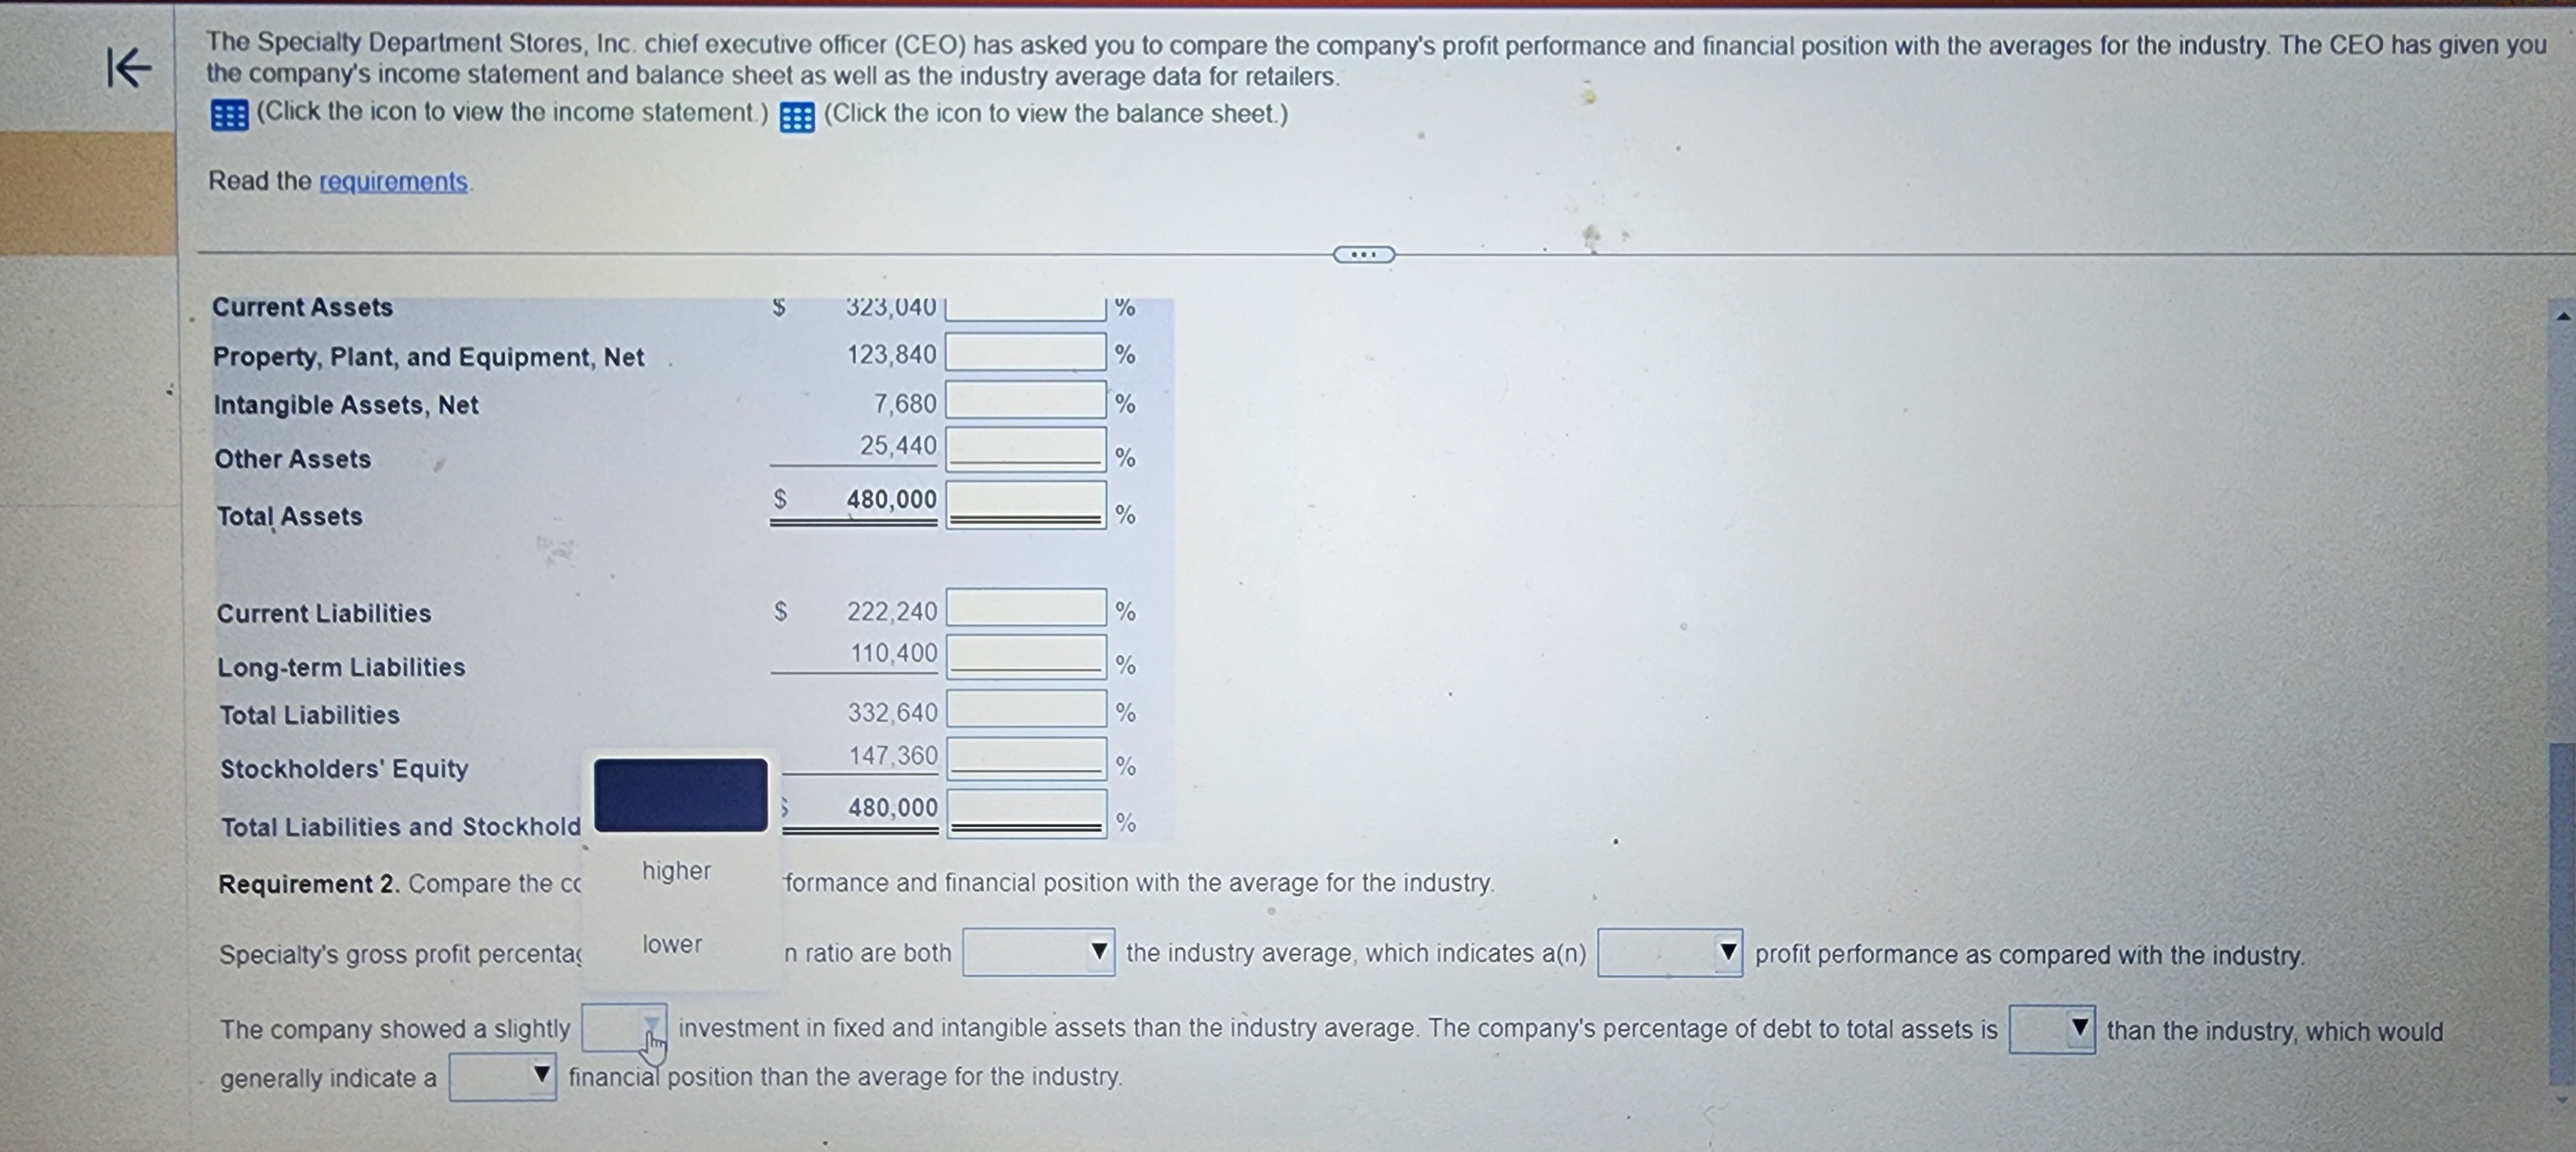
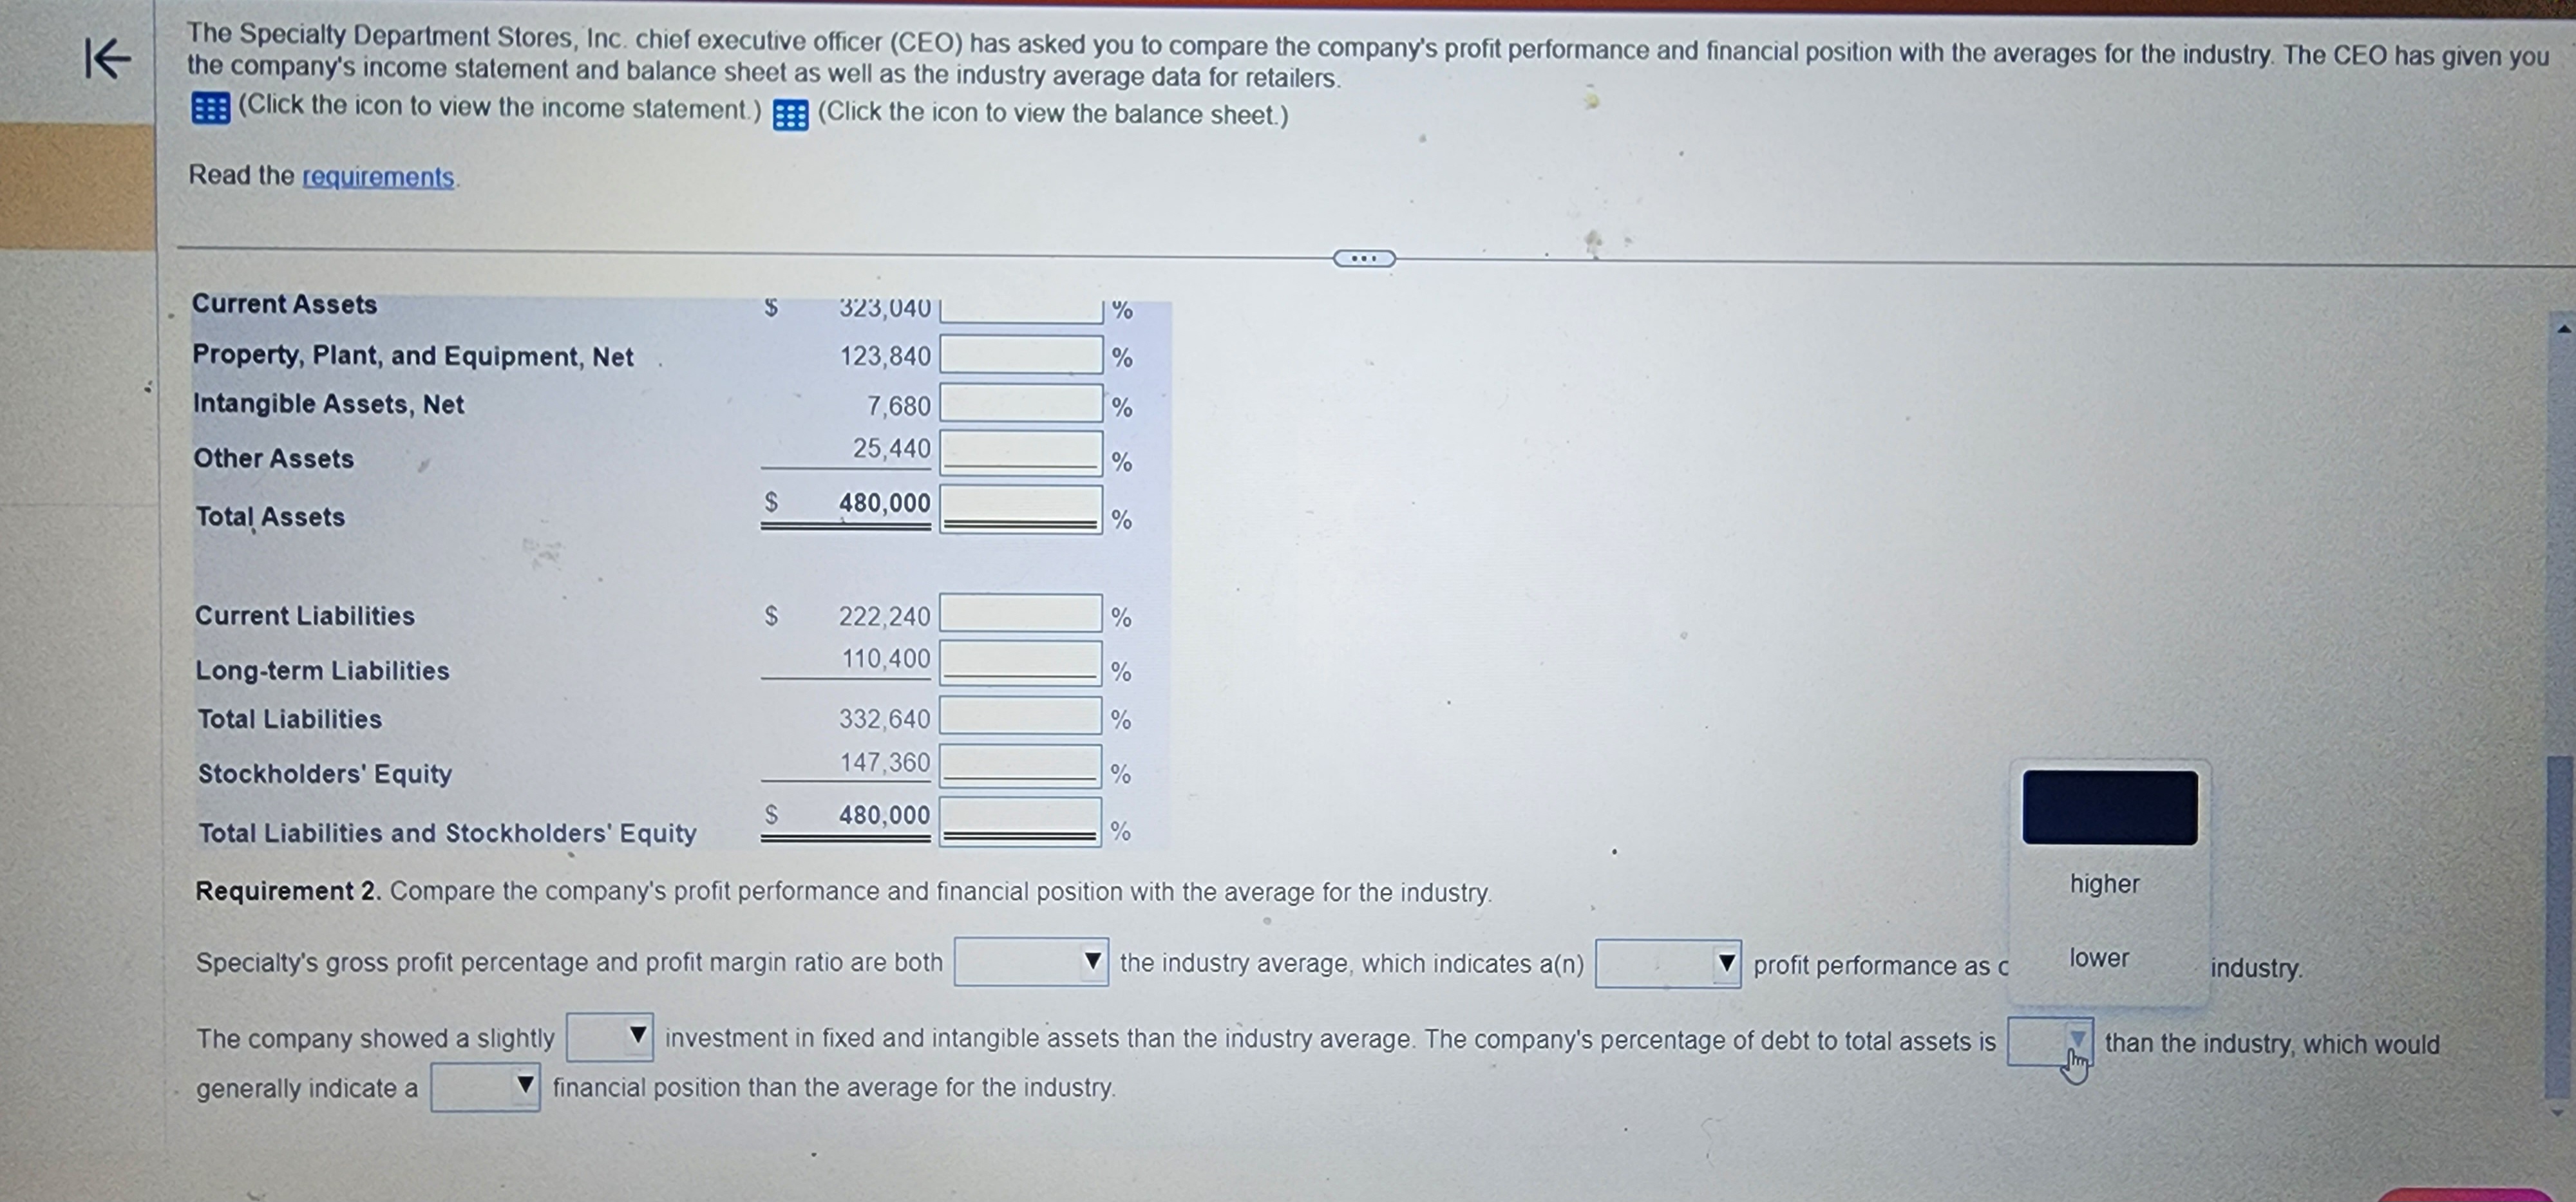
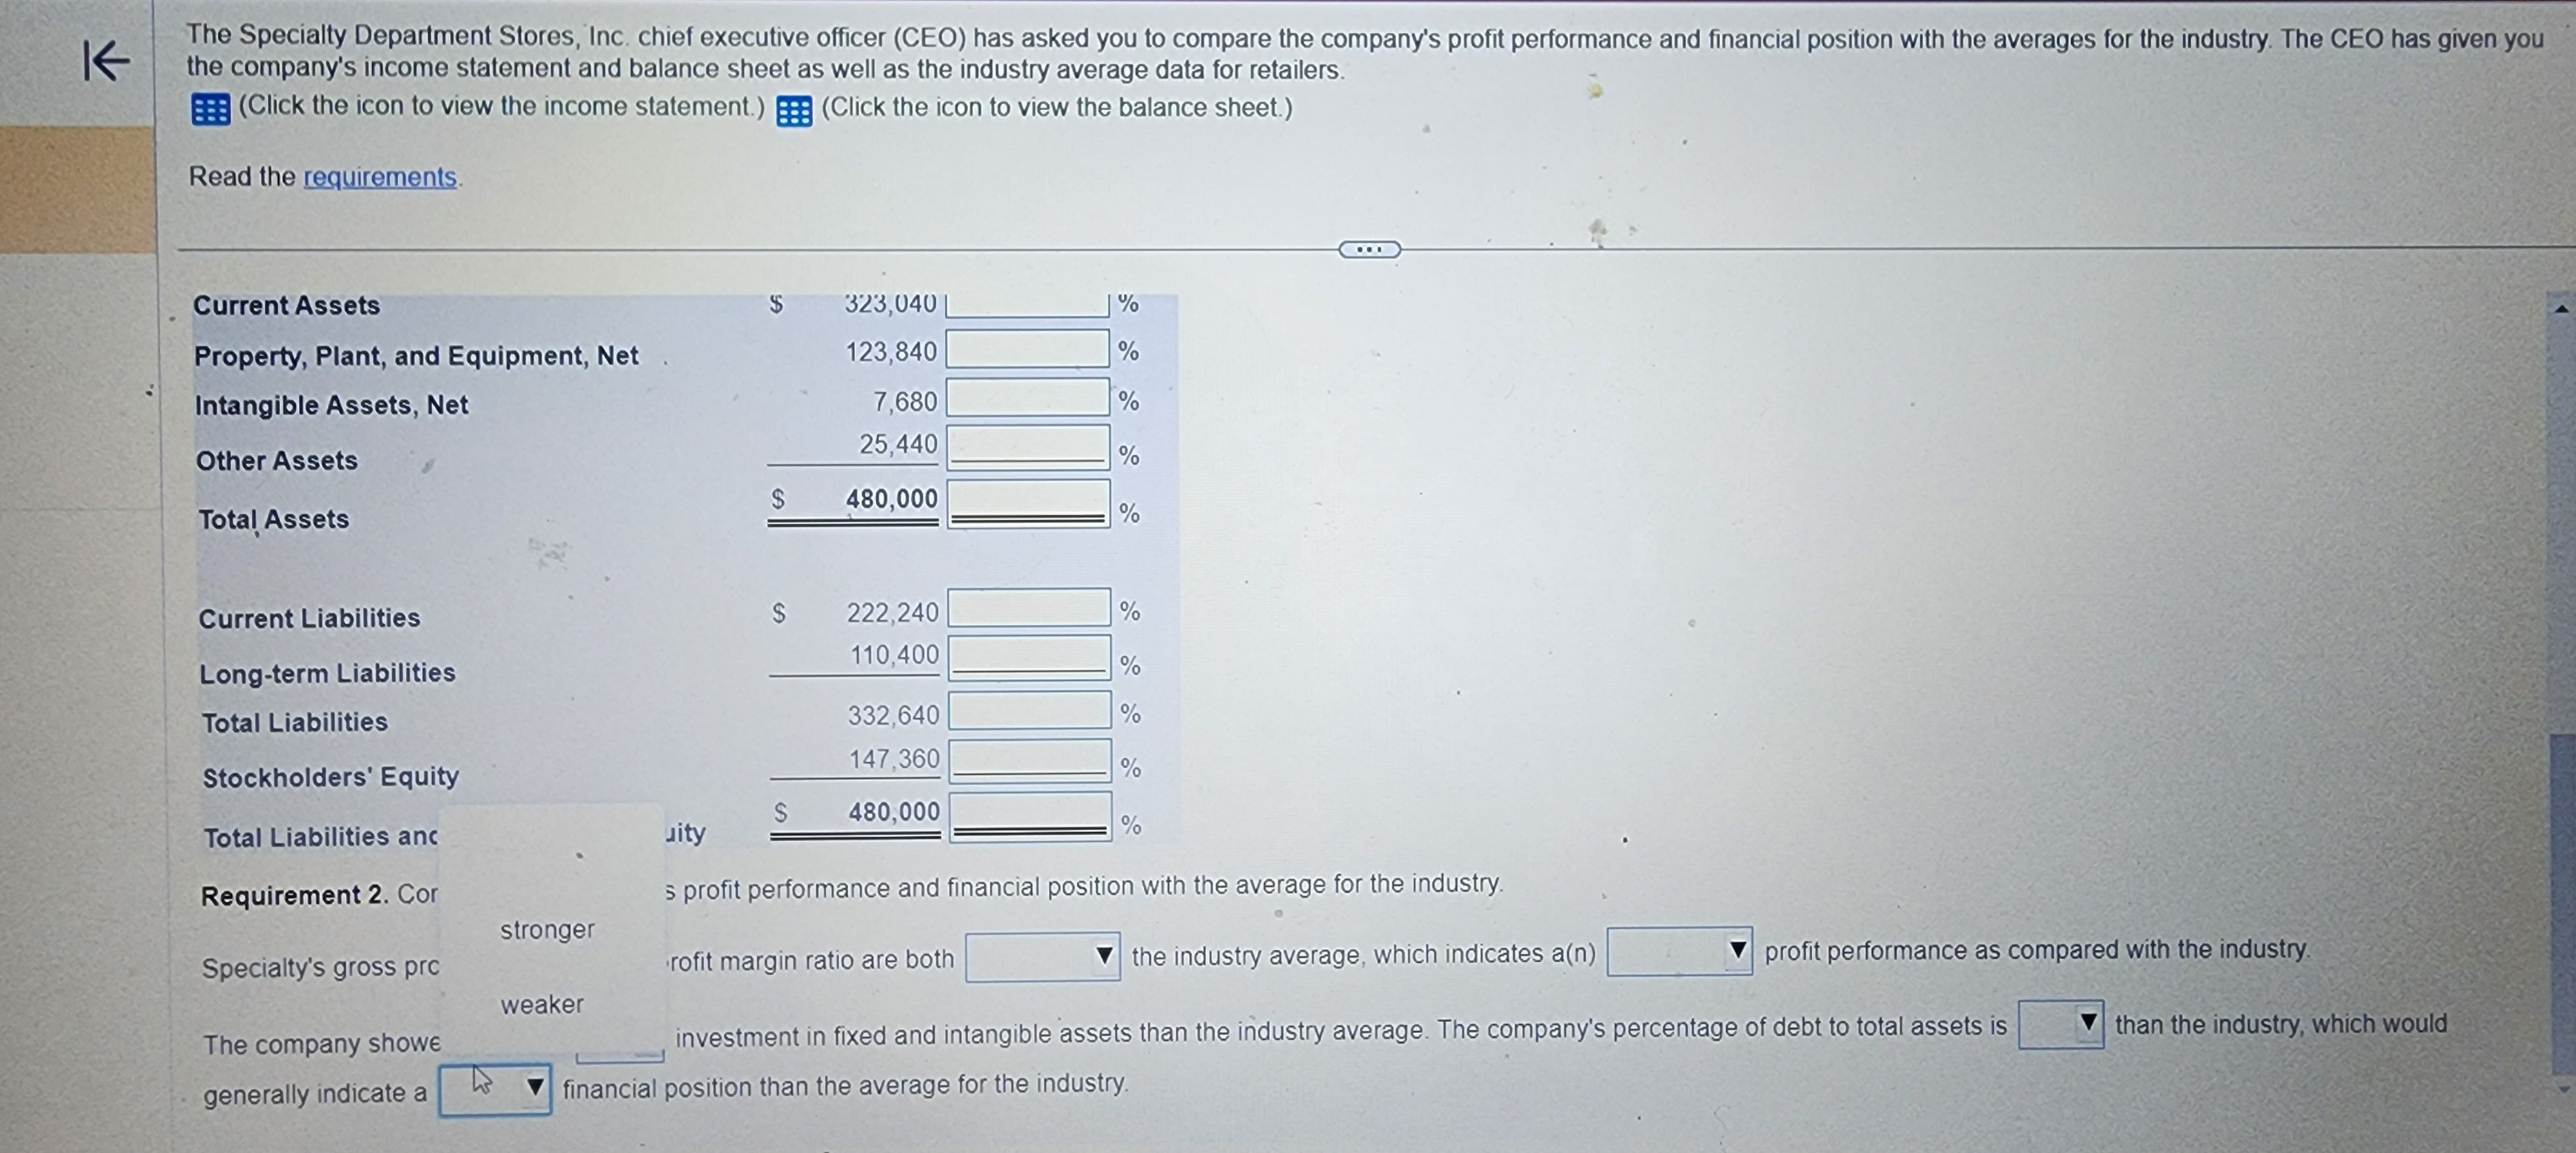
The Specialty Department Stores, Inc. chief executive officer (CEO) has asked you to compare the company's...
Fantastic news! We've Found the answer you've been seeking!
Question:
Transcribed Image Text:
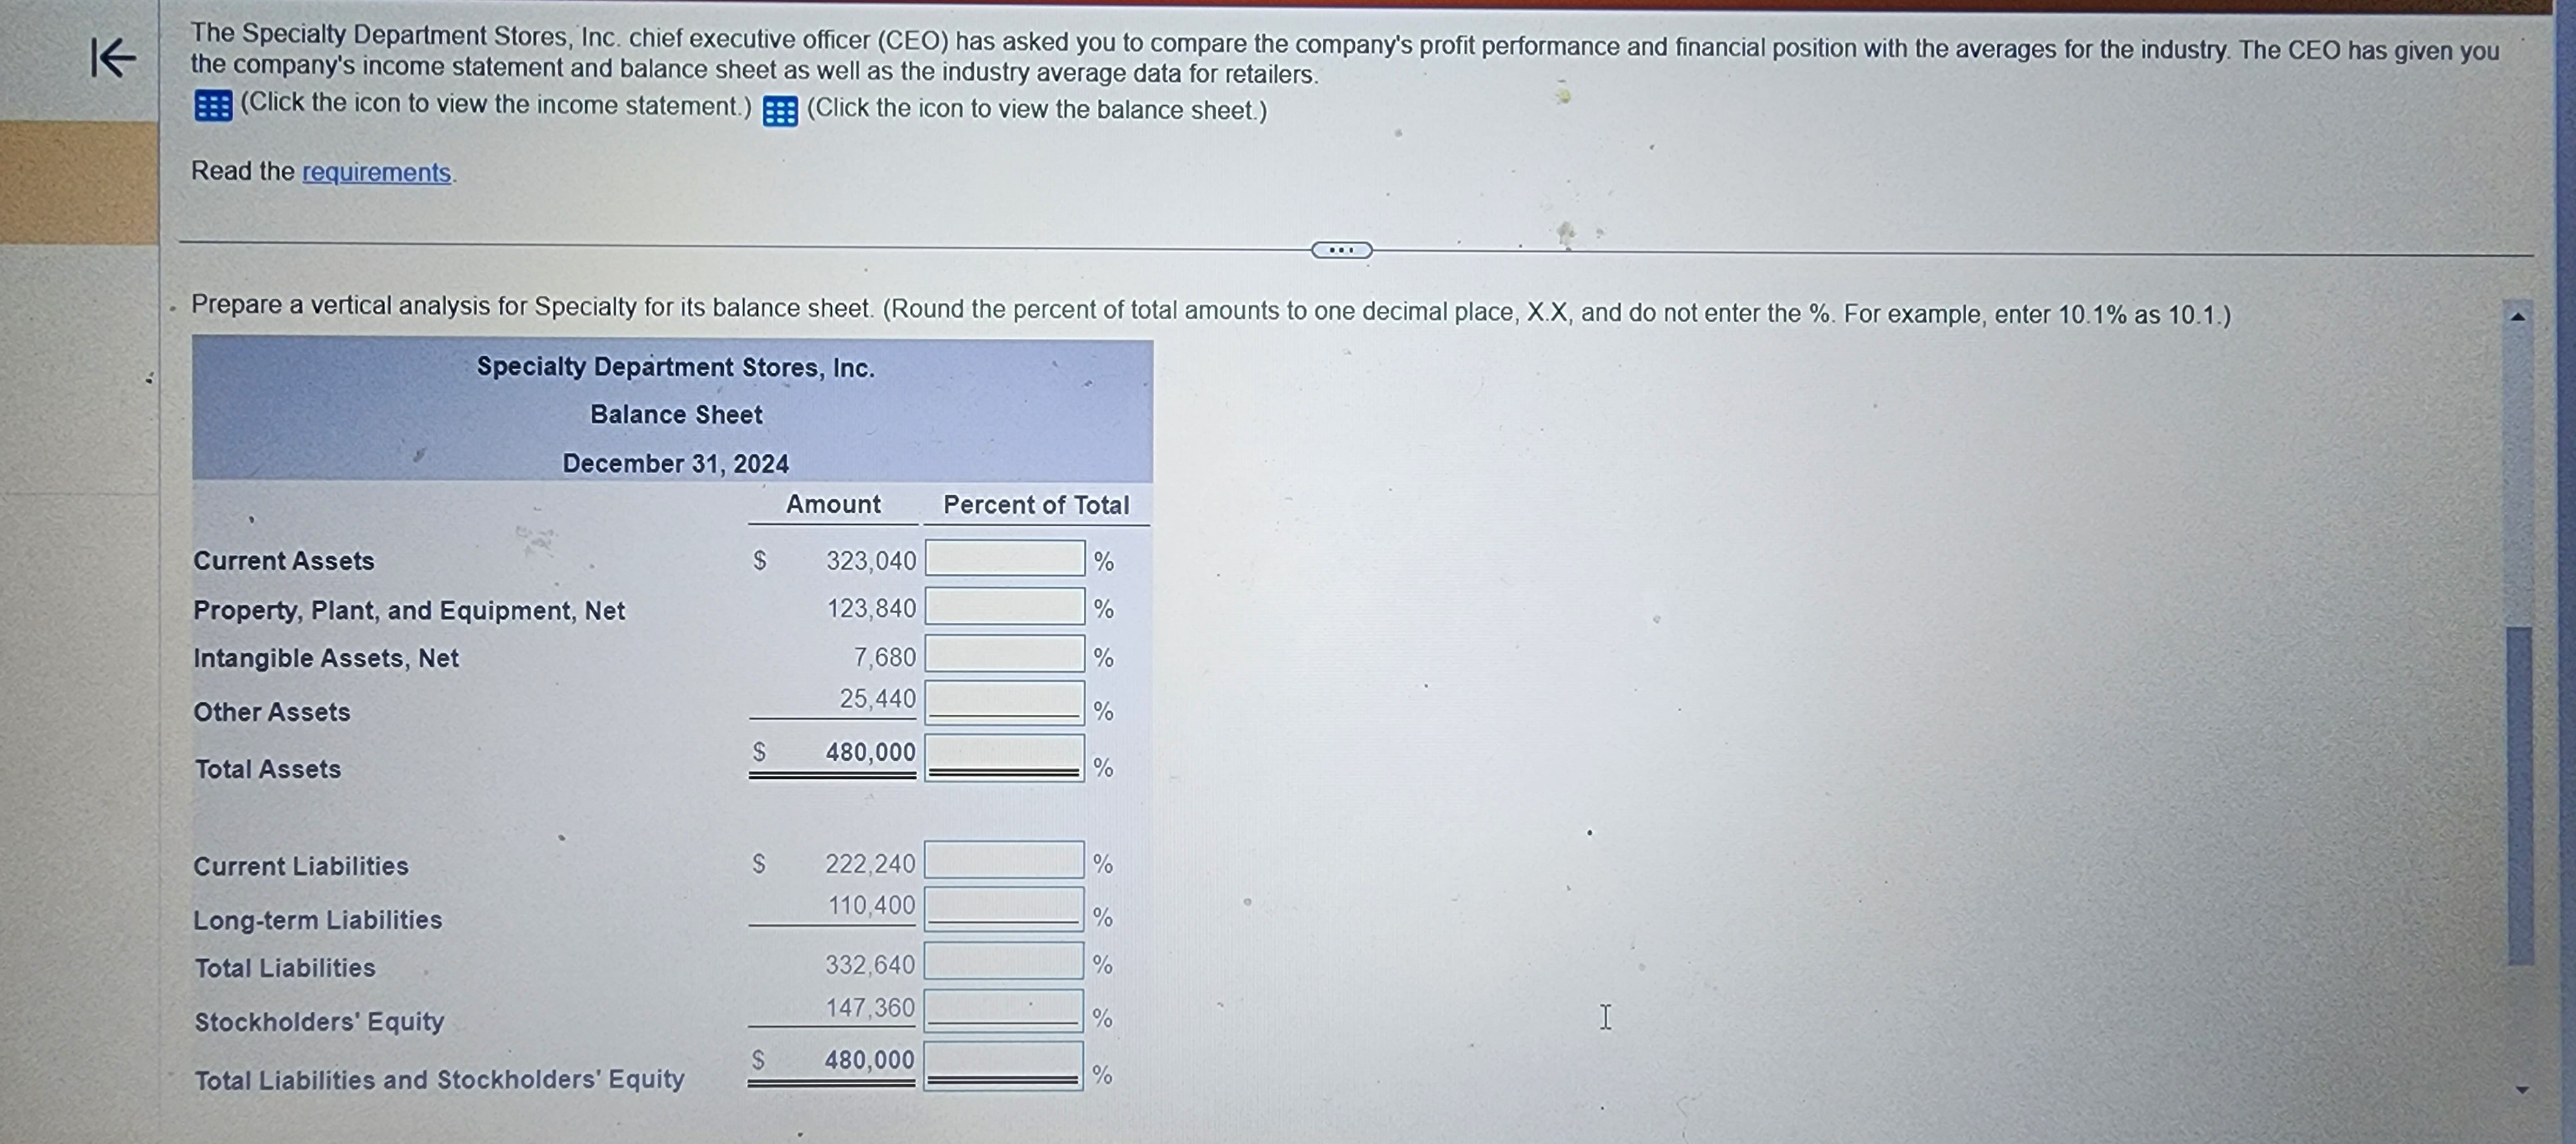
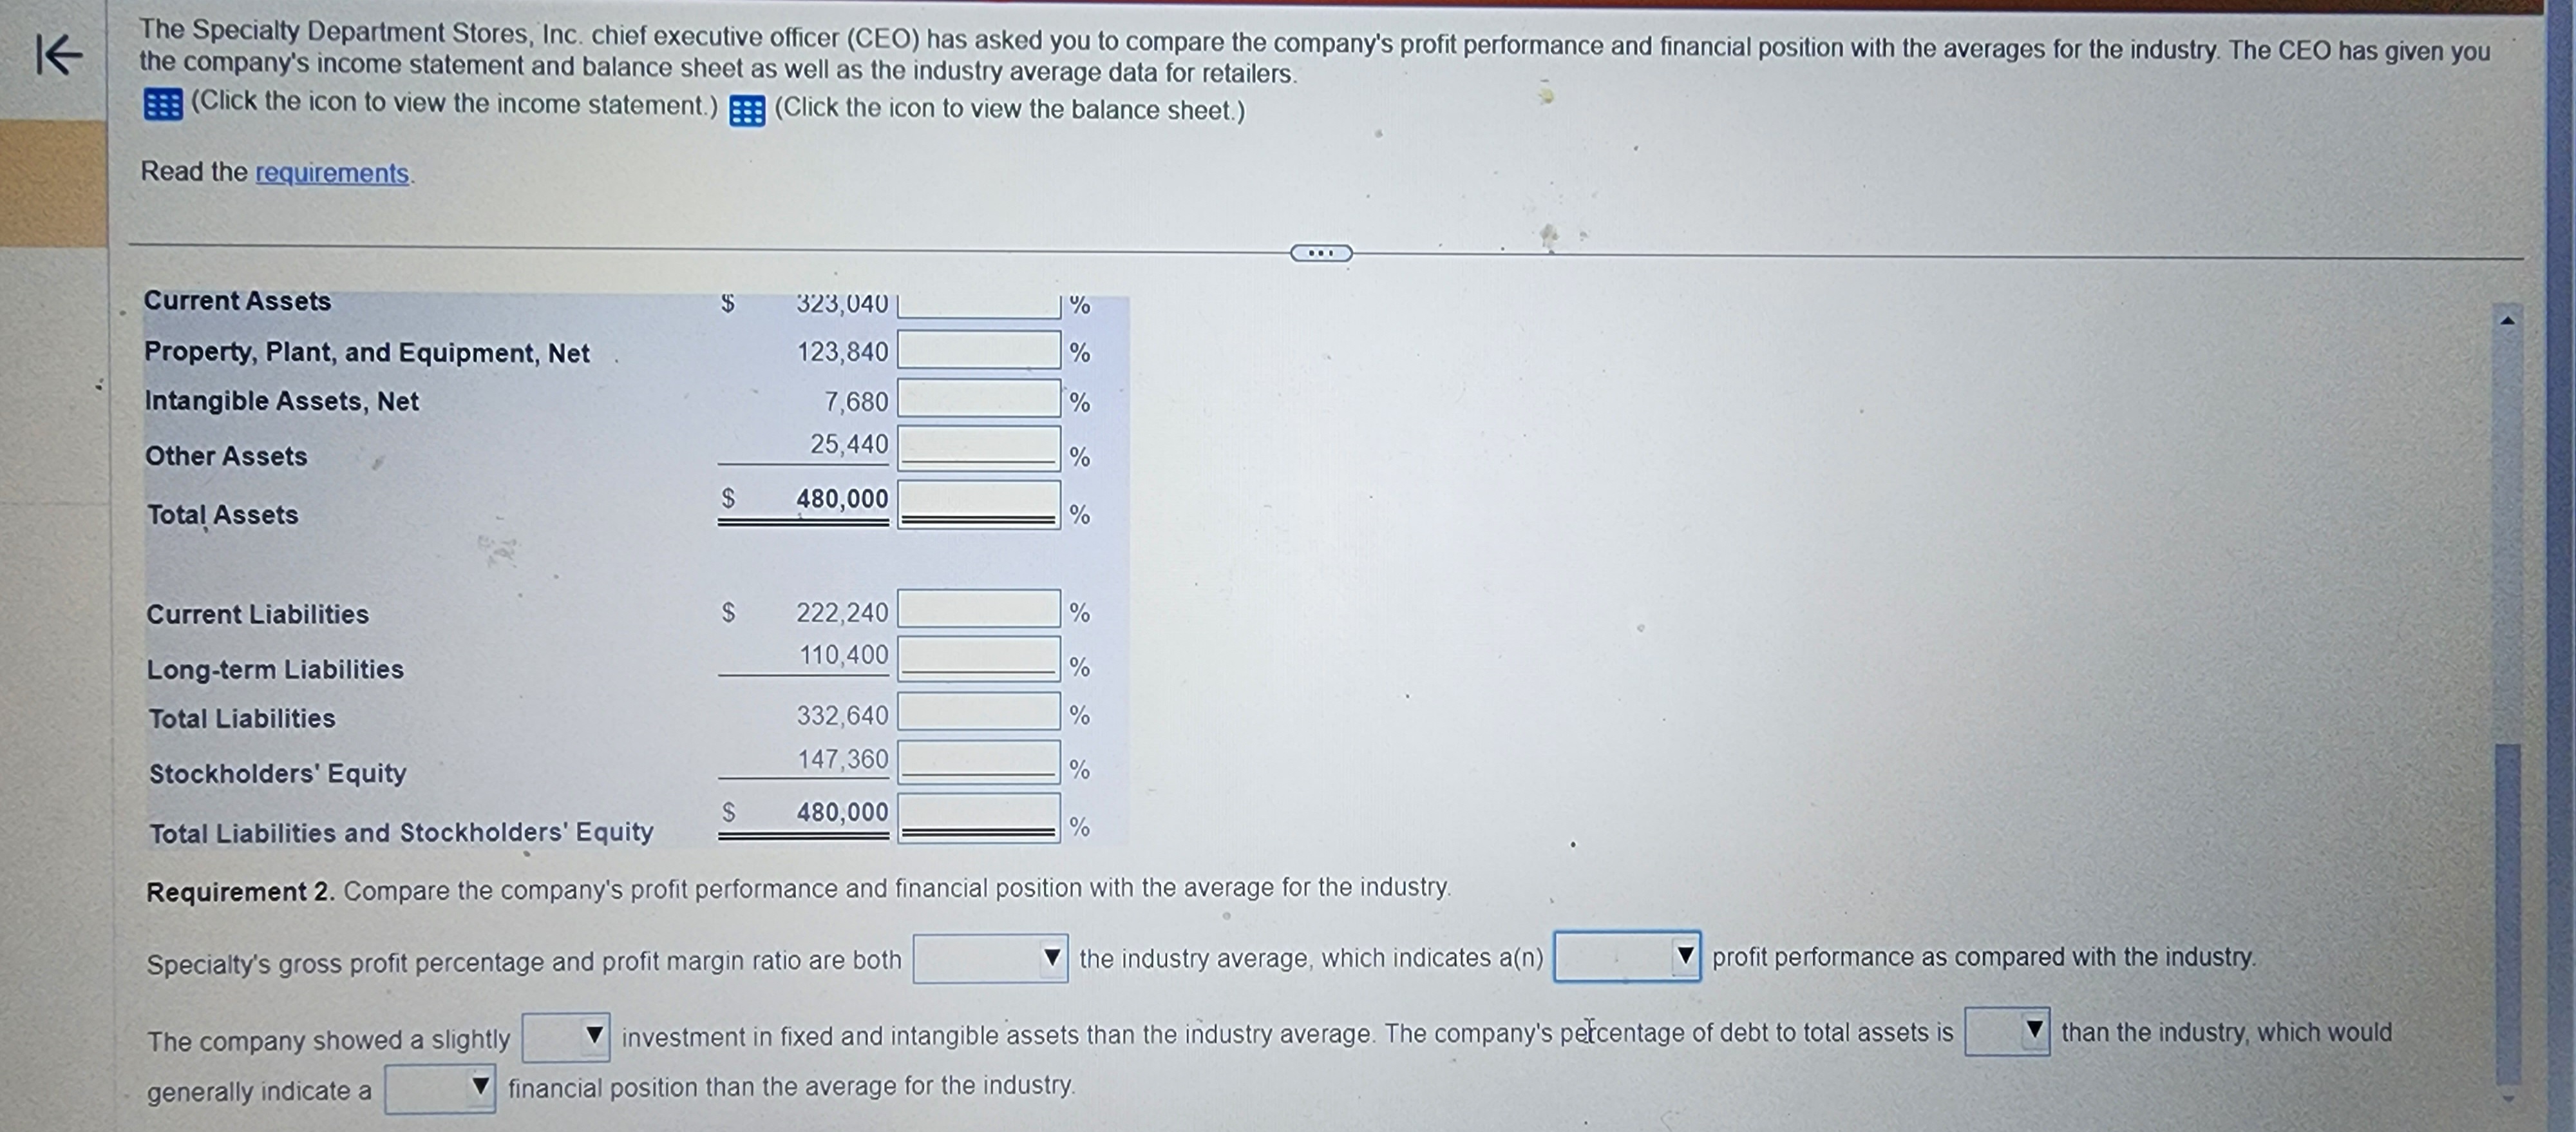
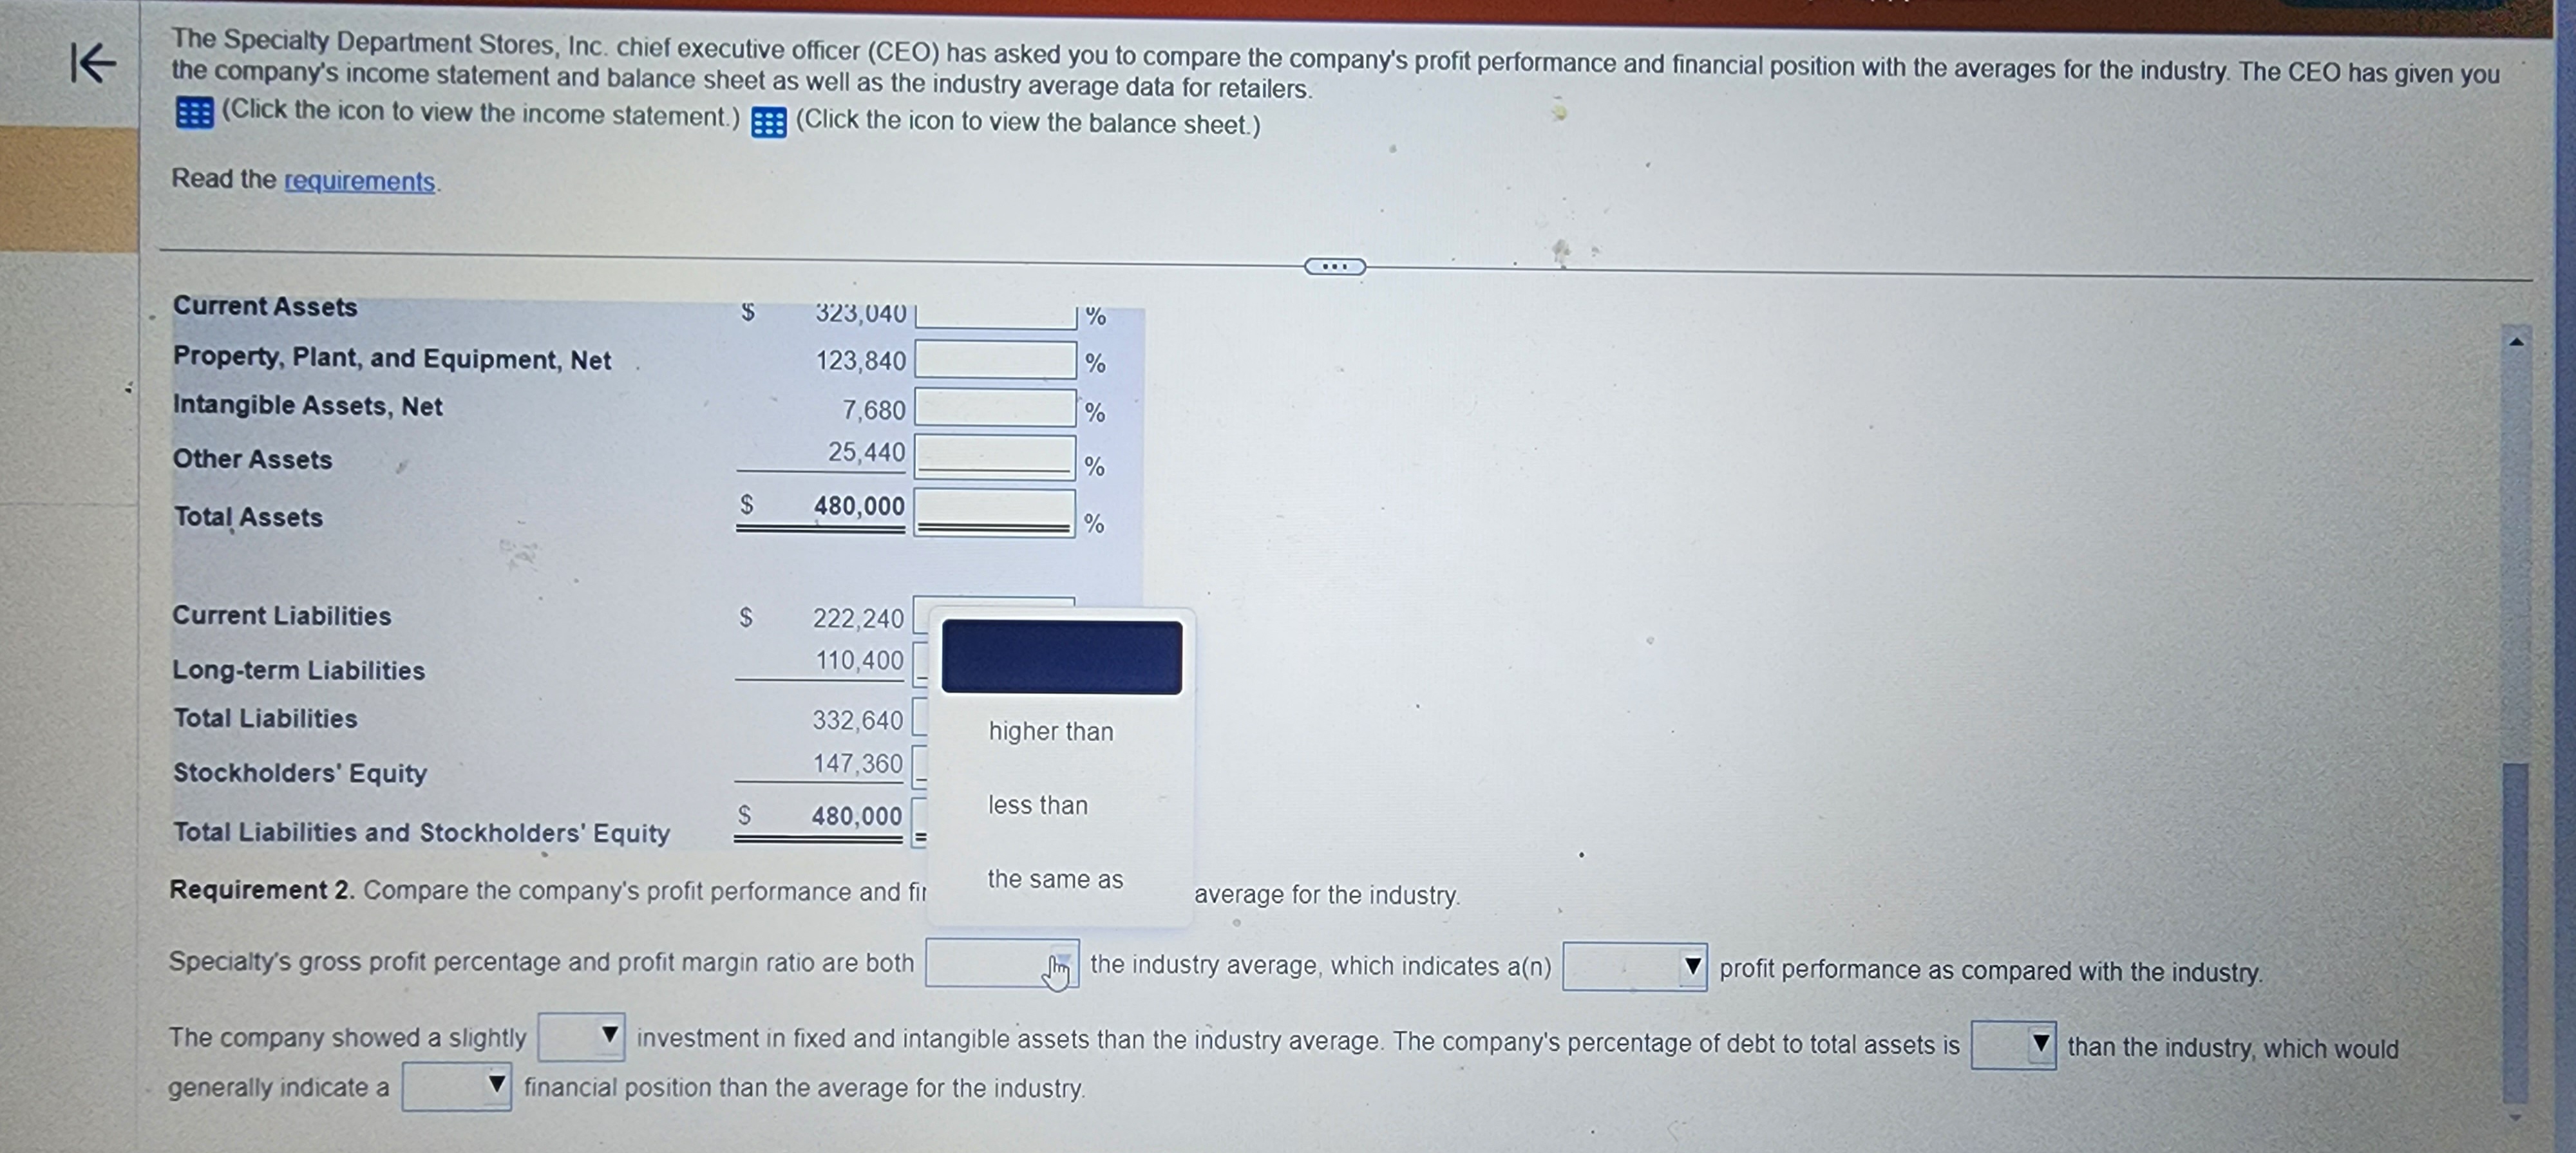
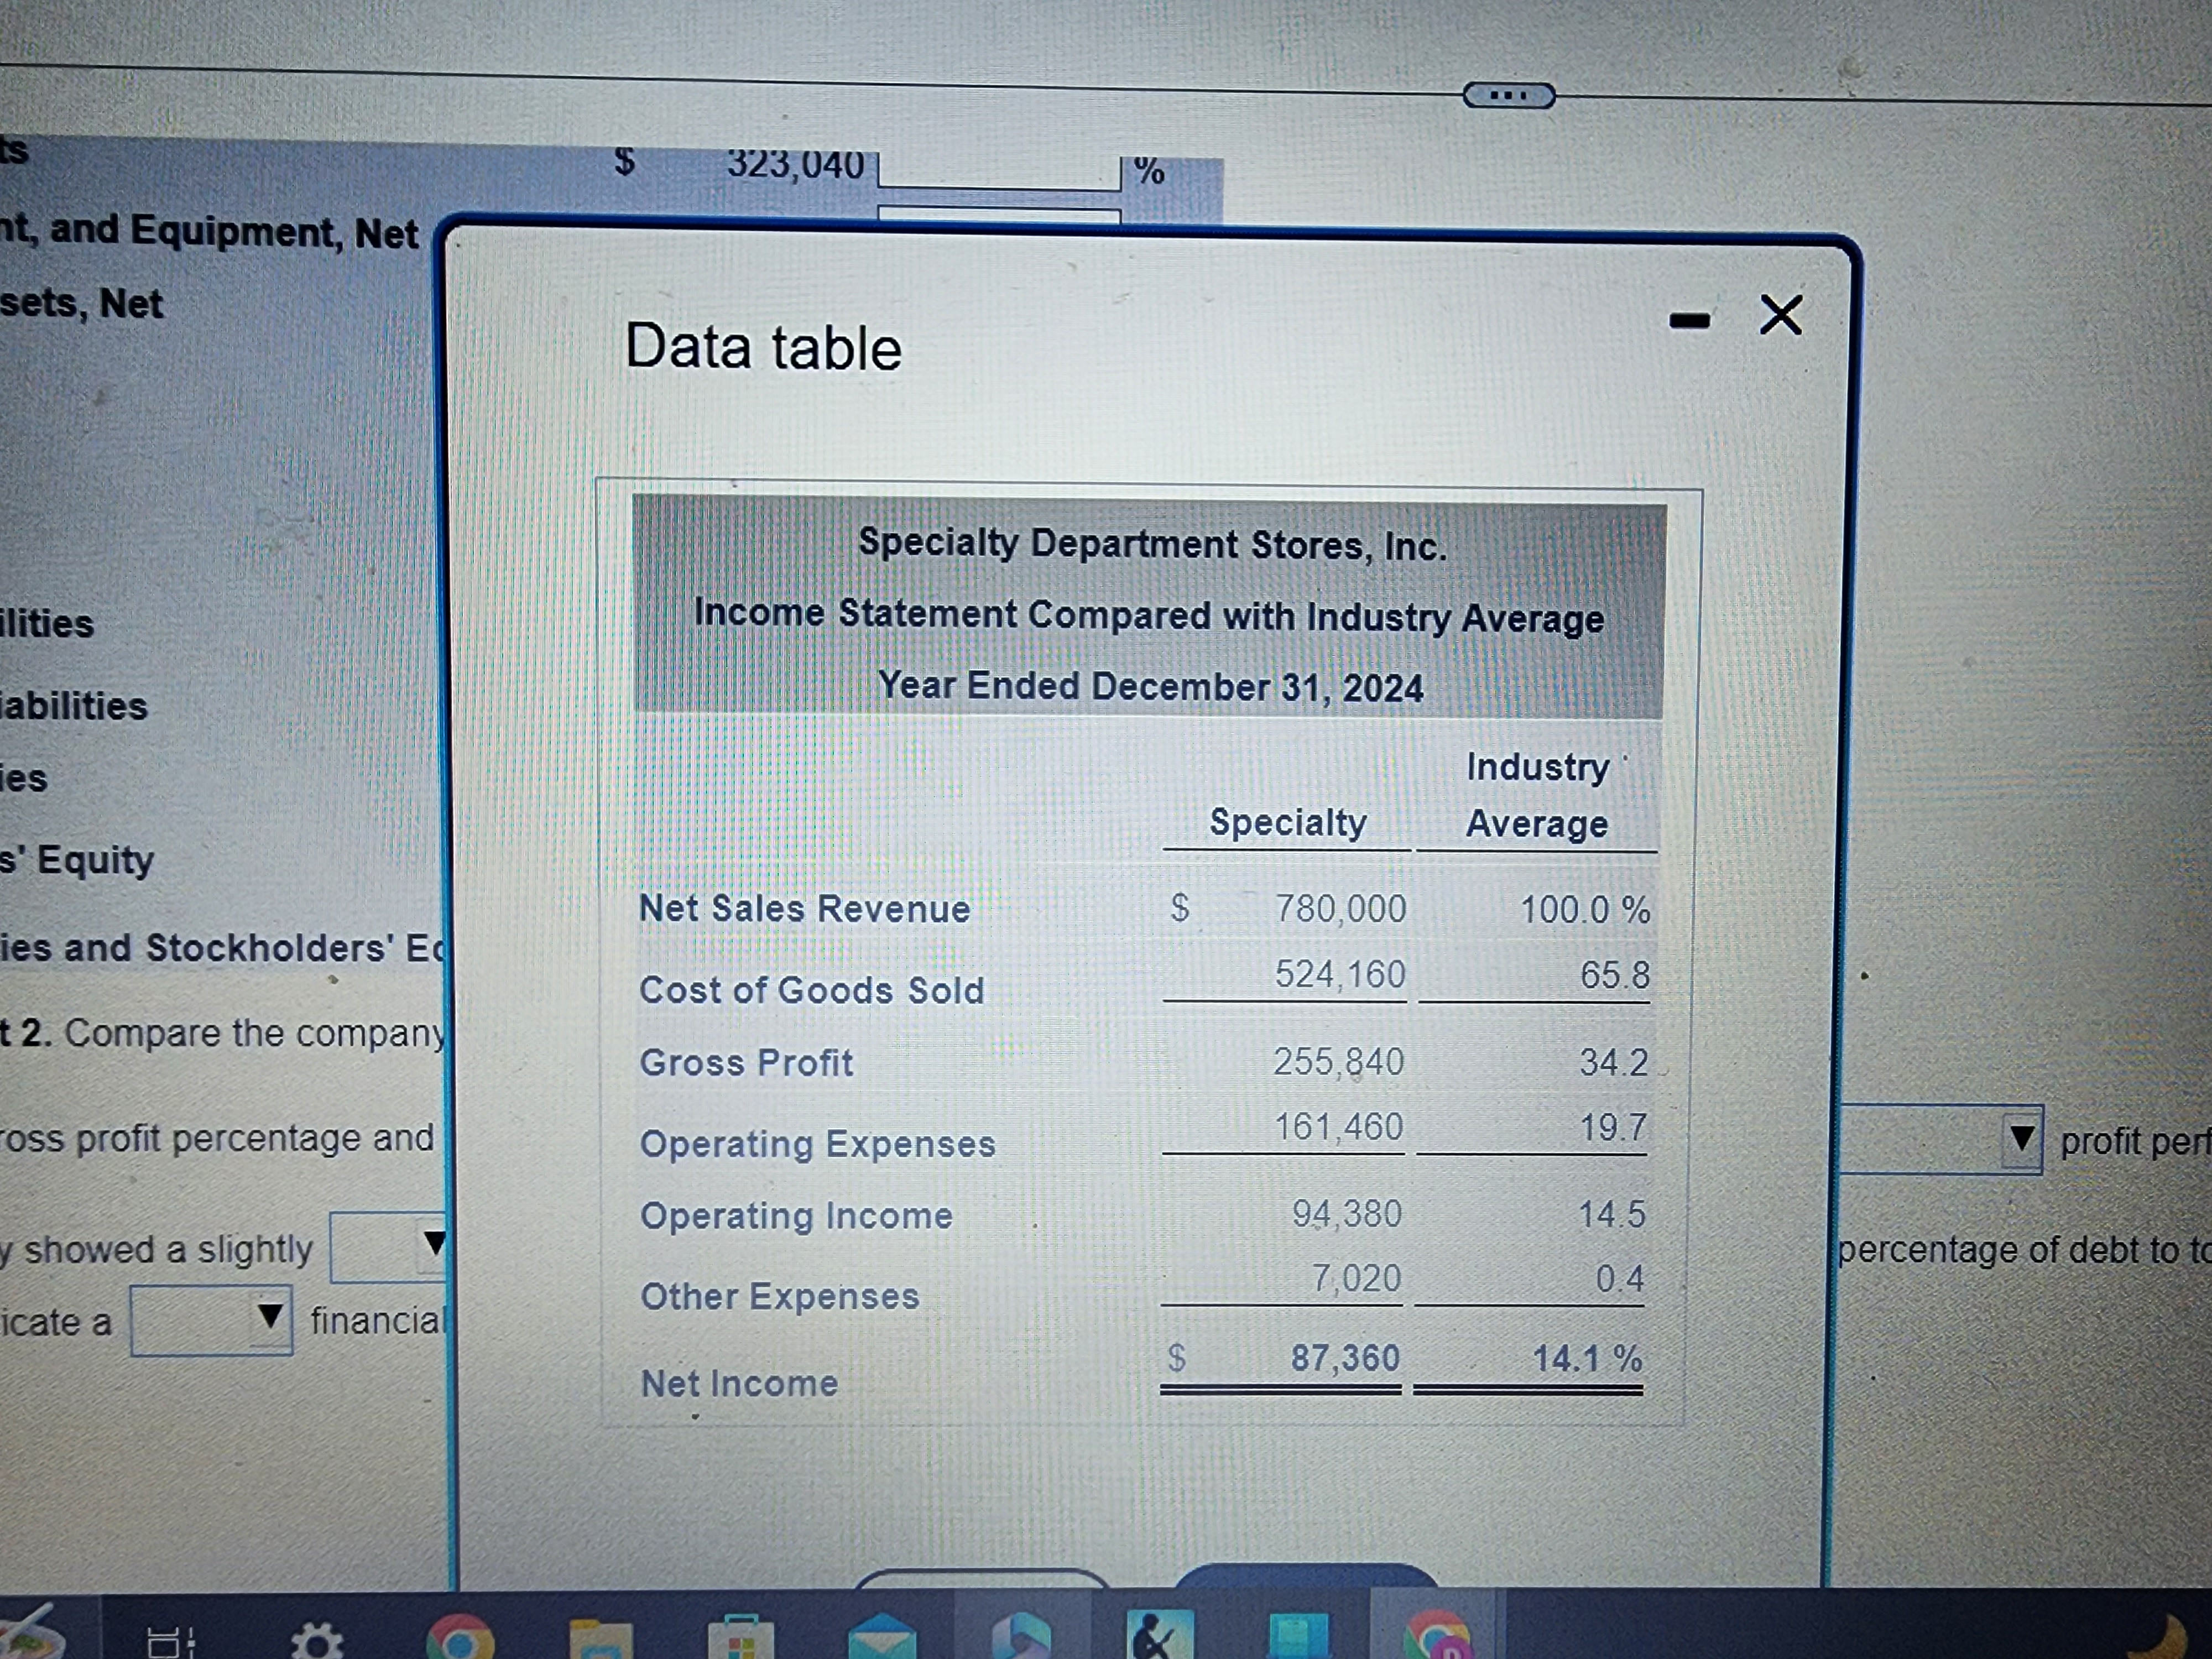
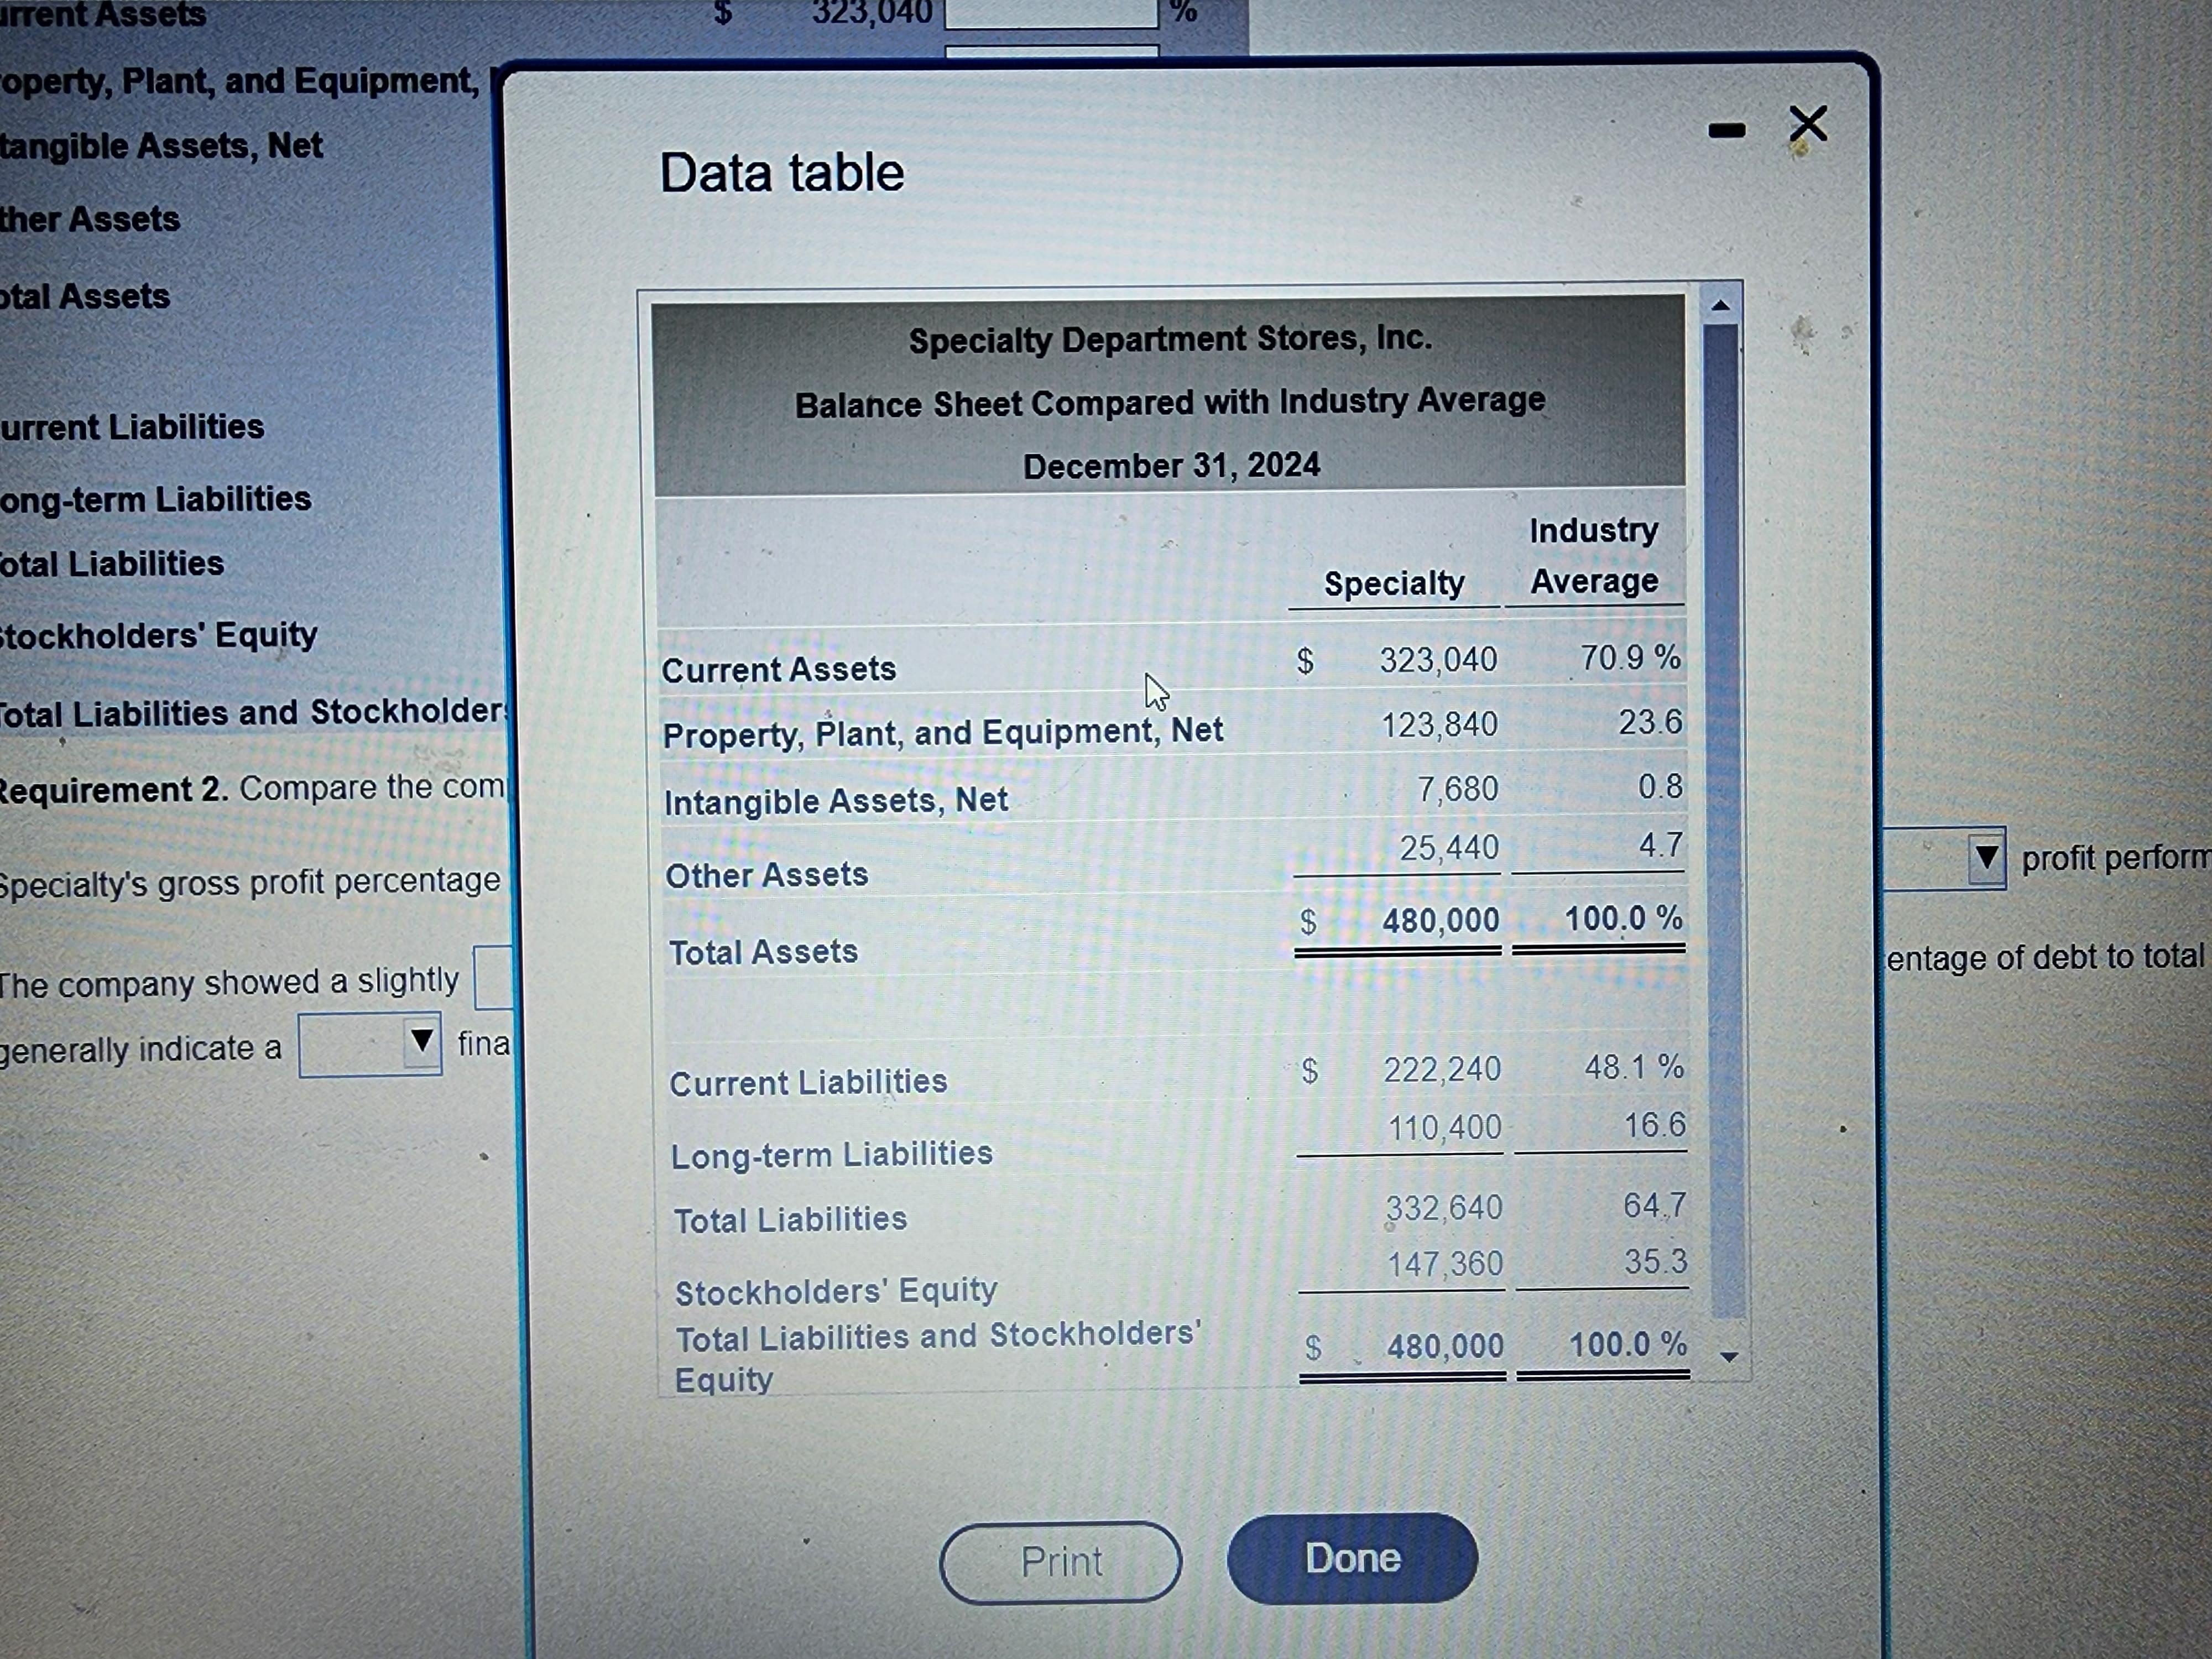
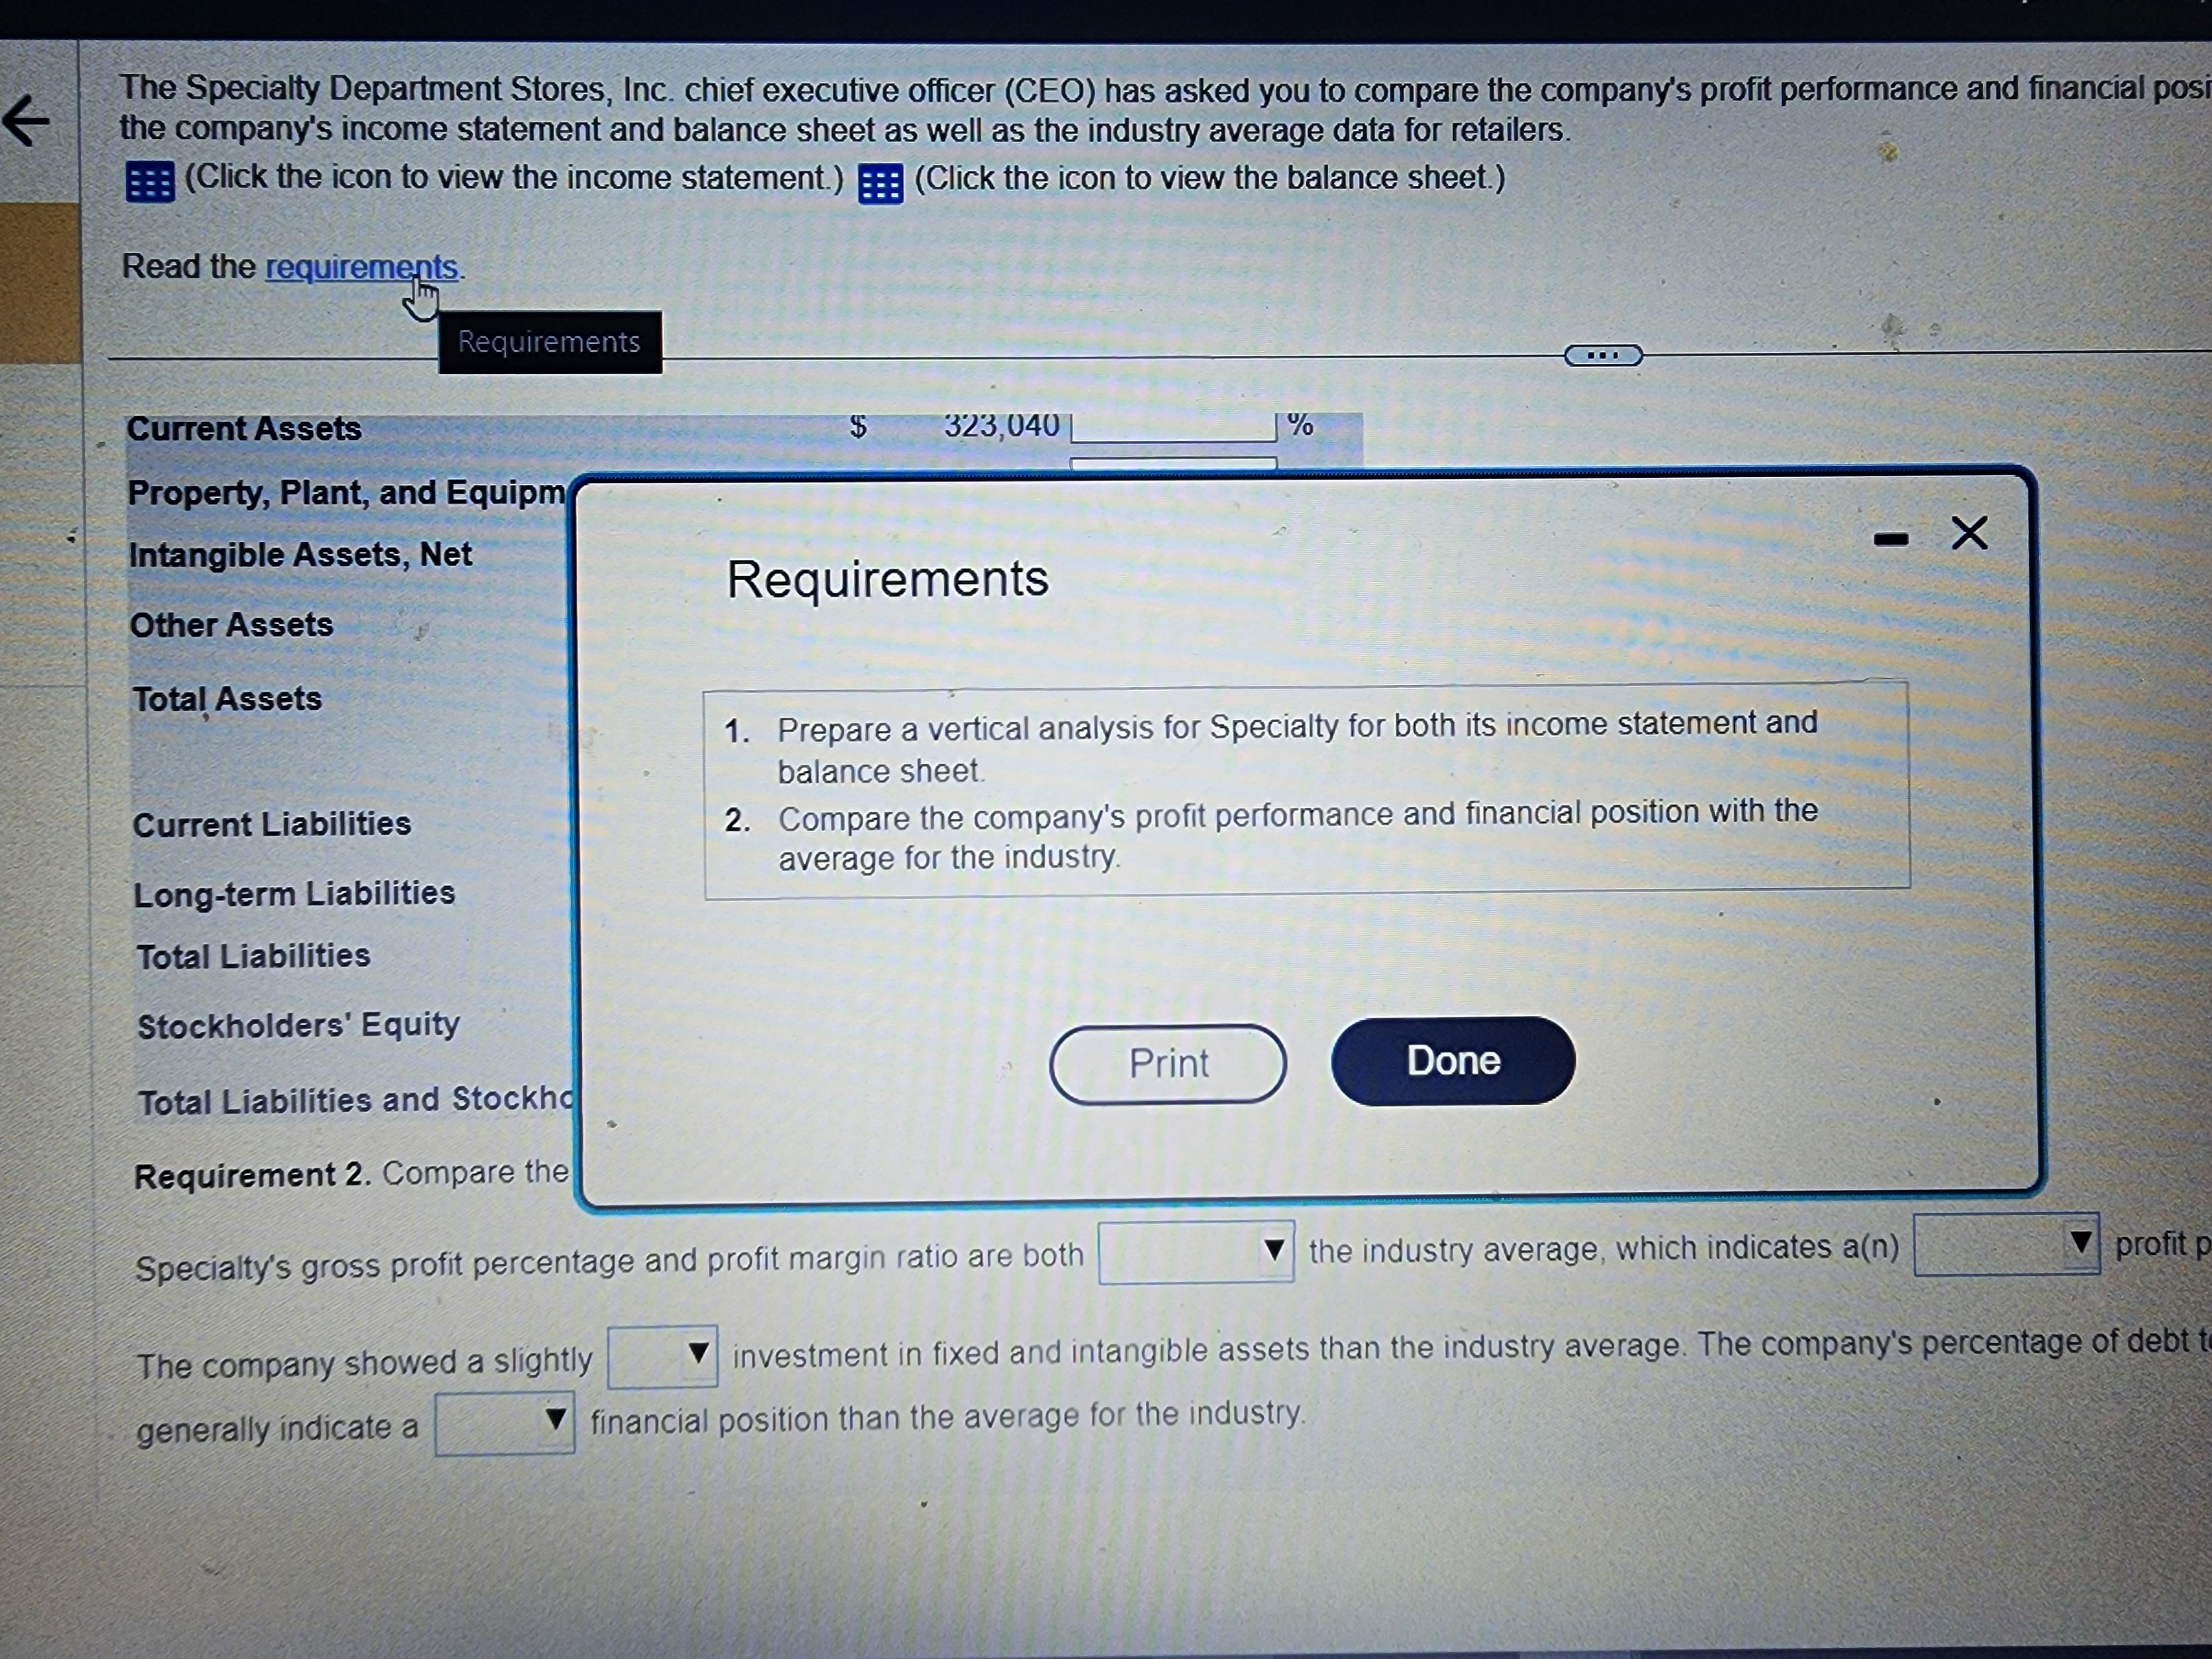
The Specialty Department Stores, Inc. chief executive officer (CEO) has asked you to compare the company's profit performance and financial position with the averages for the industry. The CEO has given you the company's income statement and balance sheet as well as the industry average data for retailers Requirement 1. Prepare a vertical analysis for Specialty for both its income statement and balance sheet. Begin by preparing a vertical analysis for Specialty for its income statement. (Round the percent of total amounts to one decimal place, XX, and do not enter the %. For example, enter 10.1% as 10.1) Specialty Department Stores, Inc. Income Statement Year Ended December 31, 2024 Amount Percent of Total Net Sales Revenue $ 780,000 524,160 Cost of Goods Sold % Gross Profit 255,840 161,460 Operating Expenses Operating Income 94,380 Other Expenses Net Income 7,020 87,360 Prepare a vertical analysis for Specialty for its balance sheet (Round the percent of total amounts to one decimal place, XX, and do not enter the %. For example, enter 10 1% as 10.1.) K The Specialty Department Stores, Inc. chief executive officer (CEO) has asked you to compare the company's profit performance and financial position with the averages for the industry. The CEO has given you the company's income statement and balance sheet as well as the industry average data for retailers. (Click the icon to view the balance sheet.) (Click the icon to view the income statement.) Read the requirements. Prepare a vertical analysis for Specialty for its balance sheet. (Round the percent of total amounts to one decimal place, X.X, and do not enter the %. For example, enter 10.1% as 10.1.) Specialty Department Stores, Inc. Balance Sheet December 31, 2024 Amount Percent of Total Current Assets $ 323,040 % Property, Plant, and Equipment, Net 123,840 % Intangible Assets, Net 7,680 % 25,440 % Other Assets $ 480,000 % Total Assets Current Liabilities Long-term Liabilities $ 222,240 % 110,400 % 332,640 % Total Liabilities 147,360 I % Stockholders' Equity $ 480,000 % Total Liabilities and Stockholders' Equity K The Specialty Department Stores, Inc. chief executive officer (CEO) has asked you to compare the company's profit performance and financial position with the averages for the industry. The CEO has given you the company's income statement and balance sheet as well as the industry average data for retailers. (Click the icon to view the balance sheet.) BEE (Click the icon to view the income statement.) Read the requirements. Current Assets $ 323,040 Property, Plant, and Equipment, Net 123,840 7,680 Do do do % % % Intangible Assets, Net 25,440 % Other Assets $ 480,000 % Total Assets Current Liabilities $ 222,240 % 110,400 Long-term Liabilities % Total Liabilities 332,640 % 147,360 Stockholders' Equity % $ 480,000 Total Liabilities and Stockholders' Equity % Requirement 2. Compare the company's profit performance and financial position with the average for the industry. Specialty's gross profit percentage and profit margin ratio are both the industry average, which indicates a(n) profit performance as compared with the industry. The company showed a slightly generally indicate a investment in fixed and intangible assets than the industry average. The company's percentage of debt to total assets is financial position than the average for the industry. than the industry, which would The Specialty Department Stores, Inc. chief executive officer (CEO) has asked you to compare the company's profit performance and financial position with the averages for the industry. The CEO has given you the company's income statement and balance sheet as well as the industry average data for retailers. (Click the icon to view the balance sheet.) (Click the icon to view the income statement.) Read the requirements. Current Assets $ 323,040 % Property, Plant, and Equipment, Net 123,840 % Intangible Assets, Net 7,680 % 25,440 Other Assets % $ 480,000 Total Assets % Current Liabilities Long-term Liabilities $ 222,240 110,400 Total Liabilities 332,640 higher than Stockholders' Equity $ 147,360 480,000 less than Total Liabilities and Stockholders' Equity the same as Requirement 2. Compare the company's profit performance and fir average for the industry. the industry average, which indicates a(n) Specialty's gross profit percentage and profit margin ratio are both The company showed a slightly generally indicate a profit performance as compared with the industry. than the industry, which would investment in fixed and intangible assets than the industry average. The company's percentage of debt to total assets is financial position than the average for the industry. K The Specialty Department Stores, Inc. chief executive officer (CEO) has asked you to compare the company's profit performance and financial position with the averages for the industry. The CEO has given you the company's income statement and balance sheet as well as the industry average data for retailers. (Click the icon to view the balance sheet.) BEE (Click the icon to view the income statement.) Read the requirements. Current Assets Property, Plant, and Equipment, Net Intangible Assets, Net Other Assets Total Assets $ 323,040 % 123,840 % 7,680 % 25,440 % $ 480,000 % Current Liabilities $ 222,240 % 110,400 Long-term Liabilities % Total Liabilities 332,640 % 147,360 % Stockholders' Equity $ 480,000 % Total Liabilities and Stockholders' Equity comparable favorable Requirement 2. Compare the company's profit performance and financial position with the average for the industry. Specialty's gross profit percentage and profit margin ratio are both unfavorable the industry average, which indicates a(n) profit performance as compared with the industry. The company showed a slightly generally indicate a investment in fixed and intangible assets than the industry average. The company's percentage of debt to total assets is financial position than the average for the industry. than the industry, which would K The Specialty Department Stores, Inc. chief executive officer (CEO) has asked you to compare the company's profit performance and financial position with the averages for the industry. The CEO has given you the company's income statement and balance sheet as well as the industry average data for retailers. (Click the icon to view the balance sheet.) (Click the icon to view the income statement.) Read the requirements. Current Assets Property, Plant, and Equipment, Net Intangible Assets, Net Other Assets Total Assets $ 323,040 % 123,840 % 7,680 % 25,440 % $ 480,000 % Current Liabilities Long-term Liabilities Total Liabilities Stockholders' Equity Total Liabilities and Stockhold Requirement 2. Compare the cc $ 222,240 % 110,400 % 332,640 % 147,360 % 480,000 % higher formance and financial position with the average for the industry. lower Specialty's gross profit percentag n ratio are both the industry average, which indicates a(n) profit performance as compared with the industry. The company showed a slightly generally indicate a investment in fixed and intangible assets than the industry average. The company's percentage of debt to total assets is financial position than the average for the industry. than the industry, which would K The Specialty Department Stores, Inc. chief executive officer (CEO) has asked you to compare the company's profit performance and financial position with the averages for the industry. The CEO has given you the company's income statement and balance sheet as well as the industry average data for retailers. (Click the icon to view the income statement.) Read the requirements. (Click the icon to view the balance sheet.) Current Assets $ 323,040 L % Property, Plant, and Equipment, Net 123,840 % Intangible Assets, Net 7,680 % 25.440 Other Assets % $ 480,000 Total Assets % Current Liabilities $ 222,240 % 110,400 Long-term Liabilities % Total Liabilities 332,640 % 147,360 % Stockholders' Equity $ 480,000 Total Liabilities and Stockholders' Equity % Requirement 2. Compare the company's profit performance and financial position with the average for the industry. Specialty's gross profit percentage and profit margin ratio are both higher the industry average, which indicates a(n) profit performance as c lower industry. The company showed a slightly generally indicate a investment in fixed and intangible assets than the industry average. The company's percentage of debt to total assets is financial position than the average for the industry. than the industry, which would K The Specialty Department Stores, Inc. chief executive officer (CEO) has asked you to compare the company's profit performance and financial position with the averages for the industry. The CEO has given you the company's income statement and balance sheet as well as the industry average data for retailers. (Click the icon to view the balance sheet.) (Click the icon to view the income statement.) Read the requirements. Current Assets 323,040 % Property, Plant, and Equipment, Net 123,840 % Intangible Assets, Net 7,680 % 25,440 Other Assets % $ 480,000 Total Assets % Current Liabilities Long-term Liabilities Total Liabilities Stockholders' Equity Total Liabilities anc Requirement 2. Cor $ 222,240 % 110,400 % 332,640 % 147.360 % S 480,000 % uity s profit performance and financial position with the average for the industry. stronger Specialty's gross prc rofit margin ratio are both the industry average, which indicates a(n) profit performance as compared with the industry. weaker The company showe generally indicate a investment in fixed and intangible assets than the industry average. The company's percentage of debt to total assets is financial position than the average for the industry. than the industry, which would ts $ 323,040 % nt, and Equipment, Net sets, Net ilities iabilities ies s' Equity ies and Stockholders' Ed t 2. Compare the company ross profit percentage and y showed a slightly icate a D Data table Specialty Department Stores, Inc. Income Statement Compared with Industry Average Year Ended December 31, 2024 - X Industry Specialty Average Net Sales Revenue $ 780,000 100.0 % Cost of Goods Sold 524,160 65.8 Gross Profit 255,840 34.2 161,460 19.7 Operating Expenses Operating Income 94,380 14.5 7,020 0.4 Other Expenses financial $ 87,360 14.1% Net Income profit perf percentage of debt to to urrent Assets operty, Plant, and Equipment, tangible Assets, Net ther Assets otal Assets % 323,040 Data table Specialty Department Stores, Inc. Balance Sheet Compared with Industry Average - X final urrent Liabilities ong-term Liabilities Fotal Liabilities Stockholders' Equity Total Liabilities and Stockholders Requirement 2. Compare the comp Specialty's gross profit percentage The company showed a slightly generally indicate a Current Assets December 31, 2024 Property, Plant, and Equipment, Net Intangible Assets, Net Other Assets Industry Specialty Average $ 323,040 70.9% 123,840 23.6 7,680 0.8 25,440 4.7 profit perform $ 480,000 100.0 % Total Assets entage of debt to total Current Liabilities $ 222,240 48.1 % 110,400 16.6 Long-term Liabilities Total Liabilities 332,640 64.7 147,360 35.3 Stockholders' Equity Total Liabilities and Stockholders' $ 480,000 100.0 % Equity Print Done The Specialty Department Stores, Inc. chief executive officer (CEO) has asked you to compare the company's profit performance and financial posi the company's income statement and balance sheet as well as the industry average data for retailers. (Click the icon to view the income statement.) (Click the icon to view the balance sheet.) Read the requirements. Requirements $ 323,040 % Current Assets Property, Plant, and Equipm Intangible Assets, Net Other Assets Total Assets Requirements Current Liabilities Long-term Liabilities Total Liabilities Stockholders' Equity Total Liabilities and Stockho Requirement 2. Compare the 1. Prepare a vertical analysis for Specialty for both its income statement and balance sheet. 2. Compare the company's profit performance and financial position with the average for the industry. Print Done - x Specialty's gross profit percentage and profit margin ratio are both the industry average, which indicates a(n) profit p The company showed a slightly investment in fixed and intangible assets than the industry average. The company's percentage of debt t generally indicate a financial position than the average for the industry. The Specialty Department Stores, Inc. chief executive officer (CEO) has asked you to compare the company's profit performance and financial position with the averages for the industry. The CEO has given you the company's income statement and balance sheet as well as the industry average data for retailers Requirement 1. Prepare a vertical analysis for Specialty for both its income statement and balance sheet. Begin by preparing a vertical analysis for Specialty for its income statement. (Round the percent of total amounts to one decimal place, XX, and do not enter the %. For example, enter 10.1% as 10.1) Specialty Department Stores, Inc. Income Statement Year Ended December 31, 2024 Amount Percent of Total Net Sales Revenue $ 780,000 524,160 Cost of Goods Sold % Gross Profit 255,840 161,460 Operating Expenses Operating Income 94,380 Other Expenses Net Income 7,020 87,360 Prepare a vertical analysis for Specialty for its balance sheet (Round the percent of total amounts to one decimal place, XX, and do not enter the %. For example, enter 10 1% as 10.1.) K The Specialty Department Stores, Inc. chief executive officer (CEO) has asked you to compare the company's profit performance and financial position with the averages for the industry. The CEO has given you the company's income statement and balance sheet as well as the industry average data for retailers. (Click the icon to view the balance sheet.) (Click the icon to view the income statement.) Read the requirements. Prepare a vertical analysis for Specialty for its balance sheet. (Round the percent of total amounts to one decimal place, X.X, and do not enter the %. For example, enter 10.1% as 10.1.) Specialty Department Stores, Inc. Balance Sheet December 31, 2024 Amount Percent of Total Current Assets $ 323,040 % Property, Plant, and Equipment, Net 123,840 % Intangible Assets, Net 7,680 % 25,440 % Other Assets $ 480,000 % Total Assets Current Liabilities Long-term Liabilities $ 222,240 % 110,400 % 332,640 % Total Liabilities 147,360 I % Stockholders' Equity $ 480,000 % Total Liabilities and Stockholders' Equity K The Specialty Department Stores, Inc. chief executive officer (CEO) has asked you to compare the company's profit performance and financial position with the averages for the industry. The CEO has given you the company's income statement and balance sheet as well as the industry average data for retailers. (Click the icon to view the balance sheet.) BEE (Click the icon to view the income statement.) Read the requirements. Current Assets $ 323,040 Property, Plant, and Equipment, Net 123,840 7,680 Do do do % % % Intangible Assets, Net 25,440 % Other Assets $ 480,000 % Total Assets Current Liabilities $ 222,240 % 110,400 Long-term Liabilities % Total Liabilities 332,640 % 147,360 Stockholders' Equity % $ 480,000 Total Liabilities and Stockholders' Equity % Requirement 2. Compare the company's profit performance and financial position with the average for the industry. Specialty's gross profit percentage and profit margin ratio are both the industry average, which indicates a(n) profit performance as compared with the industry. The company showed a slightly generally indicate a investment in fixed and intangible assets than the industry average. The company's percentage of debt to total assets is financial position than the average for the industry. than the industry, which would The Specialty Department Stores, Inc. chief executive officer (CEO) has asked you to compare the company's profit performance and financial position with the averages for the industry. The CEO has given you the company's income statement and balance sheet as well as the industry average data for retailers. (Click the icon to view the balance sheet.) (Click the icon to view the income statement.) Read the requirements. Current Assets $ 323,040 % Property, Plant, and Equipment, Net 123,840 % Intangible Assets, Net 7,680 % 25,440 Other Assets % $ 480,000 Total Assets % Current Liabilities Long-term Liabilities $ 222,240 110,400 Total Liabilities 332,640 higher than Stockholders' Equity $ 147,360 480,000 less than Total Liabilities and Stockholders' Equity the same as Requirement 2. Compare the company's profit performance and fir average for the industry. the industry average, which indicates a(n) Specialty's gross profit percentage and profit margin ratio are both The company showed a slightly generally indicate a profit performance as compared with the industry. than the industry, which would investment in fixed and intangible assets than the industry average. The company's percentage of debt to total assets is financial position than the average for the industry. K The Specialty Department Stores, Inc. chief executive officer (CEO) has asked you to compare the company's profit performance and financial position with the averages for the industry. The CEO has given you the company's income statement and balance sheet as well as the industry average data for retailers. (Click the icon to view the balance sheet.) BEE (Click the icon to view the income statement.) Read the requirements. Current Assets Property, Plant, and Equipment, Net Intangible Assets, Net Other Assets Total Assets $ 323,040 % 123,840 % 7,680 % 25,440 % $ 480,000 % Current Liabilities $ 222,240 % 110,400 Long-term Liabilities % Total Liabilities 332,640 % 147,360 % Stockholders' Equity $ 480,000 % Total Liabilities and Stockholders' Equity comparable favorable Requirement 2. Compare the company's profit performance and financial position with the average for the industry. Specialty's gross profit percentage and profit margin ratio are both unfavorable the industry average, which indicates a(n) profit performance as compared with the industry. The company showed a slightly generally indicate a investment in fixed and intangible assets than the industry average. The company's percentage of debt to total assets is financial position than the average for the industry. than the industry, which would K The Specialty Department Stores, Inc. chief executive officer (CEO) has asked you to compare the company's profit performance and financial position with the averages for the industry. The CEO has given you the company's income statement and balance sheet as well as the industry average data for retailers. (Click the icon to view the balance sheet.) (Click the icon to view the income statement.) Read the requirements. Current Assets Property, Plant, and Equipment, Net Intangible Assets, Net Other Assets Total Assets $ 323,040 % 123,840 % 7,680 % 25,440 % $ 480,000 % Current Liabilities Long-term Liabilities Total Liabilities Stockholders' Equity Total Liabilities and Stockhold Requirement 2. Compare the cc $ 222,240 % 110,400 % 332,640 % 147,360 % 480,000 % higher formance and financial position with the average for the industry. lower Specialty's gross profit percentag n ratio are both the industry average, which indicates a(n) profit performance as compared with the industry. The company showed a slightly generally indicate a investment in fixed and intangible assets than the industry average. The company's percentage of debt to total assets is financial position than the average for the industry. than the industry, which would K The Specialty Department Stores, Inc. chief executive officer (CEO) has asked you to compare the company's profit performance and financial position with the averages for the industry. The CEO has given you the company's income statement and balance sheet as well as the industry average data for retailers. (Click the icon to view the income statement.) Read the requirements. (Click the icon to view the balance sheet.) Current Assets $ 323,040 L % Property, Plant, and Equipment, Net 123,840 % Intangible Assets, Net 7,680 % 25.440 Other Assets % $ 480,000 Total Assets % Current Liabilities $ 222,240 % 110,400 Long-term Liabilities % Total Liabilities 332,640 % 147,360 % Stockholders' Equity $ 480,000 Total Liabilities and Stockholders' Equity % Requirement 2. Compare the company's profit performance and financial position with the average for the industry. Specialty's gross profit percentage and profit margin ratio are both higher the industry average, which indicates a(n) profit performance as c lower industry. The company showed a slightly generally indicate a investment in fixed and intangible assets than the industry average. The company's percentage of debt to total assets is financial position than the average for the industry. than the industry, which would K The Specialty Department Stores, Inc. chief executive officer (CEO) has asked you to compare the company's profit performance and financial position with the averages for the industry. The CEO has given you the company's income statement and balance sheet as well as the industry average data for retailers. (Click the icon to view the balance sheet.) (Click the icon to view the income statement.) Read the requirements. Current Assets 323,040 % Property, Plant, and Equipment, Net 123,840 % Intangible Assets, Net 7,680 % 25,440 Other Assets % $ 480,000 Total Assets % Current Liabilities Long-term Liabilities Total Liabilities Stockholders' Equity Total Liabilities anc Requirement 2. Cor $ 222,240 % 110,400 % 332,640 % 147.360 % S 480,000 % uity s profit performance and financial position with the average for the industry. stronger Specialty's gross prc rofit margin ratio are both the industry average, which indicates a(n) profit performance as compared with the industry. weaker The company showe generally indicate a investment in fixed and intangible assets than the industry average. The company's percentage of debt to total assets is financial position than the average for the industry. than the industry, which would ts $ 323,040 % nt, and Equipment, Net sets, Net ilities iabilities ies s' Equity ies and Stockholders' Ed t 2. Compare the company ross profit percentage and y showed a slightly icate a D Data table Specialty Department Stores, Inc. Income Statement Compared with Industry Average Year Ended December 31, 2024 - X Industry Specialty Average Net Sales Revenue $ 780,000 100.0 % Cost of Goods Sold 524,160 65.8 Gross Profit 255,840 34.2 161,460 19.7 Operating Expenses Operating Income 94,380 14.5 7,020 0.4 Other Expenses financial $ 87,360 14.1% Net Income profit perf percentage of debt to to urrent Assets operty, Plant, and Equipment, tangible Assets, Net ther Assets otal Assets % 323,040 Data table Specialty Department Stores, Inc. Balance Sheet Compared with Industry Average - X final urrent Liabilities ong-term Liabilities Fotal Liabilities Stockholders' Equity Total Liabilities and Stockholders Requirement 2. Compare the comp Specialty's gross profit percentage The company showed a slightly generally indicate a Current Assets December 31, 2024 Property, Plant, and Equipment, Net Intangible Assets, Net Other Assets Industry Specialty Average $ 323,040 70.9% 123,840 23.6 7,680 0.8 25,440 4.7 profit perform $ 480,000 100.0 % Total Assets entage of debt to total Current Liabilities $ 222,240 48.1 % 110,400 16.6 Long-term Liabilities Total Liabilities 332,640 64.7 147,360 35.3 Stockholders' Equity Total Liabilities and Stockholders' $ 480,000 100.0 % Equity Print Done The Specialty Department Stores, Inc. chief executive officer (CEO) has asked you to compare the company's profit performance and financial posi the company's income statement and balance sheet as well as the industry average data for retailers. (Click the icon to view the income statement.) (Click the icon to view the balance sheet.) Read the requirements. Requirements $ 323,040 % Current Assets Property, Plant, and Equipm Intangible Assets, Net Other Assets Total Assets Requirements Current Liabilities Long-term Liabilities Total Liabilities Stockholders' Equity Total Liabilities and Stockho Requirement 2. Compare the 1. Prepare a vertical analysis for Specialty for both its income statement and balance sheet. 2. Compare the company's profit performance and financial position with the average for the industry. Print Done - x Specialty's gross profit percentage and profit margin ratio are both the industry average, which indicates a(n) profit p The company showed a slightly investment in fixed and intangible assets than the industry average. The company's percentage of debt t generally indicate a financial position than the average for the industry.
Expert Answer:
Answer rating: 100% (QA)
Specialty Department Stores Inc Income Statement Year Ended December 31 2024 Amount ... View the full answer

Posted Date:
Students also viewed these finance questions
-
Required information [The following information applies to the questions displayed below.] The following transactions pertain to Smith Training Company for Year 1: Jan. 30 Established the business...
-
The Specialty Department Stores, Inc. chief executive officer (CEO) has asked you to compare the companys profit performance and financial position with the averages for the industry. The CEO has...
-
The McConnell Department Stores, Inc. chief executive officer (CEO) has asked you to compare the companys profit performance and financial position with the averages for the industry. The CEO has...
-
The following are selected account balances from Cheela Company and Jarjar Corporation as of December 31, 2018: Cheela Jarjar Revenues P 980,000 P 560,000 Expenses 560,000 420,000 Dividend Income...
-
Email or Free mail? 1. What are the benefits and risks that Provident faces when considering maintaining their own email system or moving to services such as Gmail? 2. How is email different, if at...
-
Leverage and regulatory capital arbitrage played important roles in the financial crisis. 1. Explain how the availability of credit in the economy can suffer if asset values decline when financial...
-
Lepanto Manufacturing Company produces two industrial solvents for which the following data have been tabulated. Fixed manufacturing cost is applied to product at a rate of $1 per machine hour. The...
-
As part of the year-end audit, you are discussing the disclosure checklist with your client. The checklist identifies the items that must be disclosed in a set of GAAP financial statements. The...
-
For this Discussion Board , you will be using the following situation: Golf Challenge Corp., is a retail sports store carrying golf apparel and equipment. The store is at the end of its second year...
-
what is the pump cycle of the sewage submersible pump having the capacity of 250 gpm, with existing wet well dimension of 8 feet by 8 feet and 15 feet high? the pump capacity is 250 gpm with 30 total...
-
Jalen Company provided the following information with respect to its cash and cash equivalents on December 31, 2023. Checking account at Security Bank Checking account at BPI Payroll account...
-
The expression 729gy 7299y = kg"y" where: r = 8 = , and k k= =
-
Translate the following C code into RISC V (32-bit) assembly instructions, then convert to machine codes (hex format). Assume that the variable a, b, and c are stored in a1, a2, and a3, respectively....
-
When one mole of CH is burned, 3.27 MJ of heat is produced. Heat from burning 7.59 g of C6H6 is added to 5.69 kg of water at 21.0 C. The specific heat of liquid water is 4190 J/(kg-K). What is the...
-
In what ways can the CFAA potentially protect an individual's personal information or private life? What are its limitations in this respect? Should Congress enact a law that more clearly prohibits...
-
Give a business example that can explain and mimic the difference between shared and dedicated network segment for the business. (10)
-
What is EBIT/eps analysis? What information does it provide managers?
-
Financial accounting theory has accumulated a vast literature. A cynic might be inclined to say that the vastness of the literature is in sharp contrast to its impact on practice. (a) Describe the...
-
What is the basic difference between the purposes of financial and managerial accounting?
-
Is it possible for costs such as salaries or depreciation to end up as assets on the balance sheet? Explain.

Study smarter with the SolutionInn App