

Question: The spreadsheet is attatched, please help me answer questions 3, 4, and 7 (the ones with the x marked next to) Thanks!! 5. What is
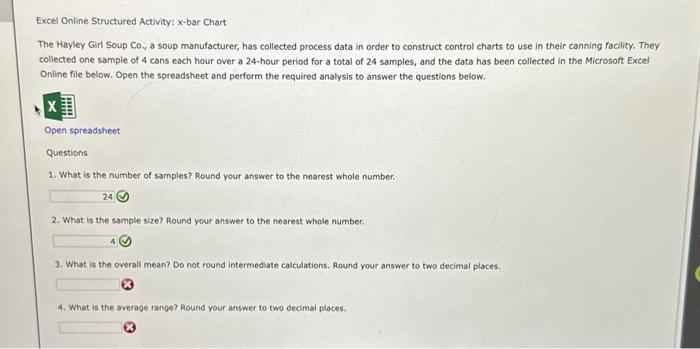
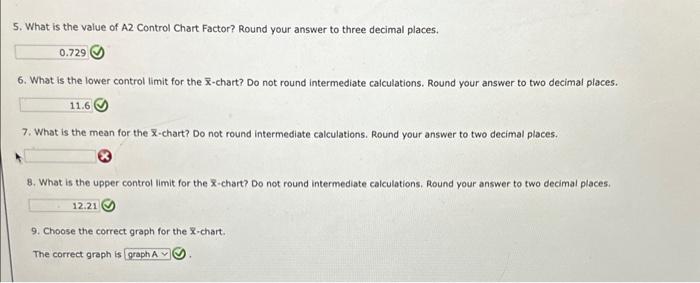
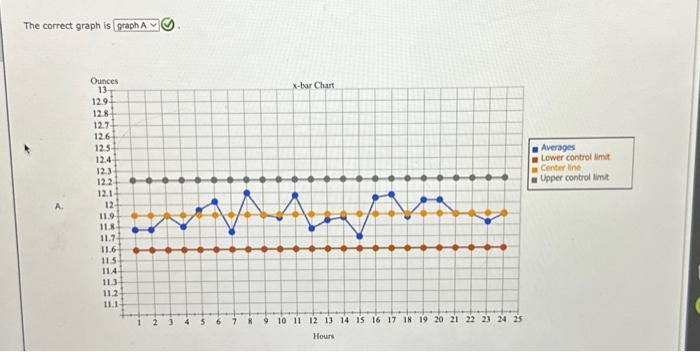
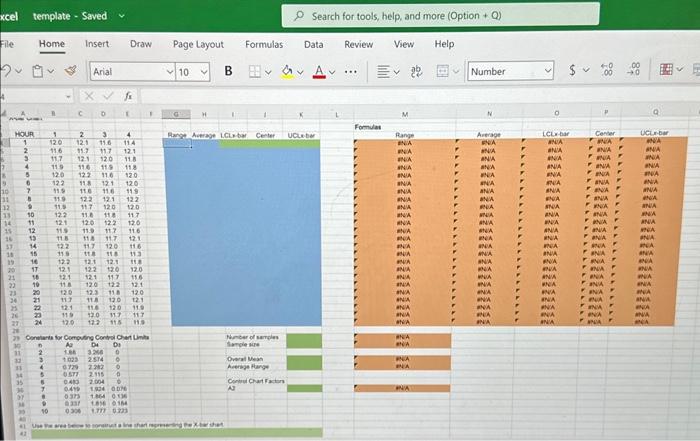
5. What is the value of A2 Control Chart Factor? Round your answer to three decimal places. 6. What is the lower control limit for the x-chart? Do not round intermediate calculations. Round your answer to two decimal places. 7. What is the mean for the x-chart? Do not round intermediate calculations. Round your answer to two decimal places. 8. What is the upper control limit for the X-chart? Do not round intermediate calculations. Round your answer to two decimal places. 9. Choose the correct graph for the X-chart. The correct graph is Excel Online Structured Activity: x-bar Chart The Hayley Girf Soup Coy a soup manufacturer, has collected process data in order to construct control charts to use in their canning facility. They collected one sample of 4 cans each hour over a 24 -hour period for a total of 24 samples, and the data has been collected in the Microsoft Excel Online file below, Open the spreadsheet and perform the required analysis to answer the questions below. Open spreadsheet Questions 1. What is the number of samples? Round your answer to the nesrest whole number. 2. What is the sample size? Round your answer to the nearest whole number. 3. What is the overall mean? Do not round intermediate calculations. Round your answer to two decimal places. 4. What is the average range? Round your answer to two decimal places. The correct graph is 5. What is the value of A2 Control Chart Factor? Round your answer to three decimal places. 6. What is the lower control limit for the x-chart? Do not round intermediate calculations. Round your answer to two decimal places. 7. What is the mean for the x-chart? Do not round intermediate calculations. Round your answer to two decimal places. 8. What is the upper control limit for the X-chart? Do not round intermediate calculations. Round your answer to two decimal places. 9. Choose the correct graph for the X-chart. The correct graph is Excel Online Structured Activity: x-bar Chart The Hayley Girf Soup Coy a soup manufacturer, has collected process data in order to construct control charts to use in their canning facility. They collected one sample of 4 cans each hour over a 24 -hour period for a total of 24 samples, and the data has been collected in the Microsoft Excel Online file below, Open the spreadsheet and perform the required analysis to answer the questions below. Open spreadsheet Questions 1. What is the number of samples? Round your answer to the nesrest whole number. 2. What is the sample size? Round your answer to the nearest whole number. 3. What is the overall mean? Do not round intermediate calculations. Round your answer to two decimal places. 4. What is the average range? Round your answer to two decimal places. The correct graph is
Step by Step Solution
There are 3 Steps involved in it

Get step-by-step solutions from verified subject matter experts