

Question: + The spreadsheet Table 6.2, presents a base case scenario. You will have to use it to construct 4 additional scenarios, two better and two
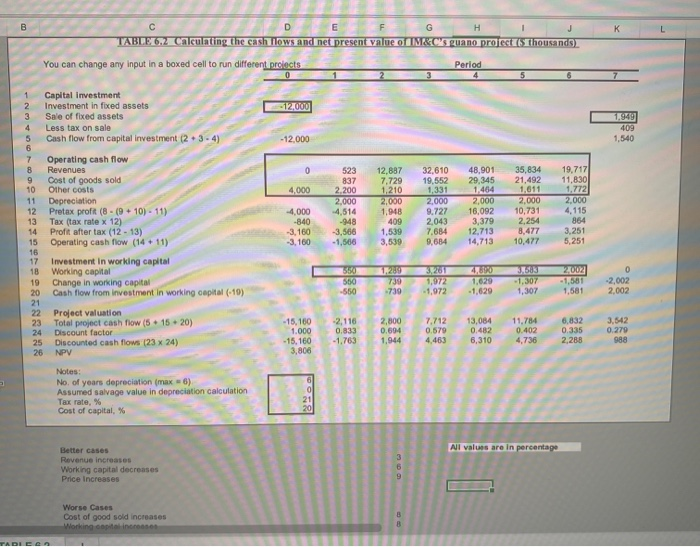
+ The spreadsheet Table 6.2, presents a base case scenario. You will have to use it to construct 4 additional scenarios, two better and two worse. In the better scenarios your revenue will increase each time in an increment as below compared to the base case, the working capital will decrease each time in increments as below and your sale price of the old equipment will increase each time in increments as below. All the other numbers will be the same as in the base case scenario. In the worst cases, the cost of goods sold will increase each time in increments as below and the working capital will increase each in increments as below. All the other numbers will stay as in the base case scenario. For example is your revenue increase increment is 5% in the first better scenario you will increase revenue by 5% and in the second (the best scenario) by 10% compared to the base case. In all other instances the same logic will apply. Once you obtained the NPV of all the 5 scenarios you will have to determine using a normal distribution assumption (see helpful materials posted) the expected NPV and its standard deviation (use the excel functions. Assuming that each scenario is equally likely, determine the ranges and probabilities for plus, minus one standard deviation and for two plus minus standard deviations around the mean. In addition, you will need to determine the probability that the NPV will be lower than zero and the probability for the NPV to be higher than your best scenario You will write a short memo with your findings (add an excel sheet) and have the memo and all five worksheets (one for each scenario) in the excel workbook that would be submitted by the deadline. HNT instead of using tables you could use the function NORM DIST on the probati B K D E G H 1 TABLE 6.2 Calculating the cash flows and net present value of M&C's guano project (5 thousands) You can change any input in a boxed cell to run different projects Period 5 0 - 12.000 1.949 409 1,540 - 12.000 0 4,000 1 Capital Investment 2 Investment in fixed assets 3 Sale of fixed assets 4 Less tax on sale 5 Cash flow from capital investment (2 + 3-4) 6 7 Operating cash flow 8 Revenues 9 Cost of goods sold 10 Other costs 11 Depreciation 12 Pretax proft (8 - (9 + 10) - 11) 13 Tax (tax rate x 12) 14 Profit after tax (12 - 13) 15 Operating cash flow (14 + 11) 16 17 Investment in working capital 18 Working capital 19 Change in working capital 20 Cash flow from investment in working capital (-10) 21 22 Project valuation 23 Total project cash flow (5 + 15 +20) 24 Discount factor 25 Discounted cash flows (23 x 24) 26 NPV 523 837 2,200 2,000 4,514 -948 -3,566 -1,566 12,887 7.729 1,210 2,000 1,948 409 1.539 3,539 32,610 19,552 1,331 2.000 9.727 2.043 7.68 9,684 48,901 29,345 1,464 2,000 16,092 3,379 12,713 14,713 35,834 21,492 1,611 2,000 10,731 19,717 11,830 1.772 2,000 4,115 864 3,251 5,251 2,254 4,000 -840 -3,160 -3,160 8,477 10,477 550 730 -739 3,261 1.972 -1,972 2002 - 1,581 1,581 0 -2,002 2.002 -1,307 1,307 -550 -1,629 -2,116 0.833 - 1.763 2,800 0.694 7.712 0.579 4,463 13,084 0.482 6,310 11,784 0.402 4,736 6,832 0.335 2,288 3.542 0.279 988 1,944 Notes: No. of years depreciation (max. 6) Assumed salvage value in depreciation calculation Tax rate, % Cost of capital, % 6 0 21 20 All values are in percentage Better cases Revenue increases Working capital decreases Price Increases Worse Cases Cost of good sold increases Working options TADIO
Step by Step Solution
There are 3 Steps involved in it

Get step-by-step solutions from verified subject matter experts