

Question: The stacked dotplot compares life expectancies from a random sample of 5 countries from Asia and a random sample of 5 countries in Africa
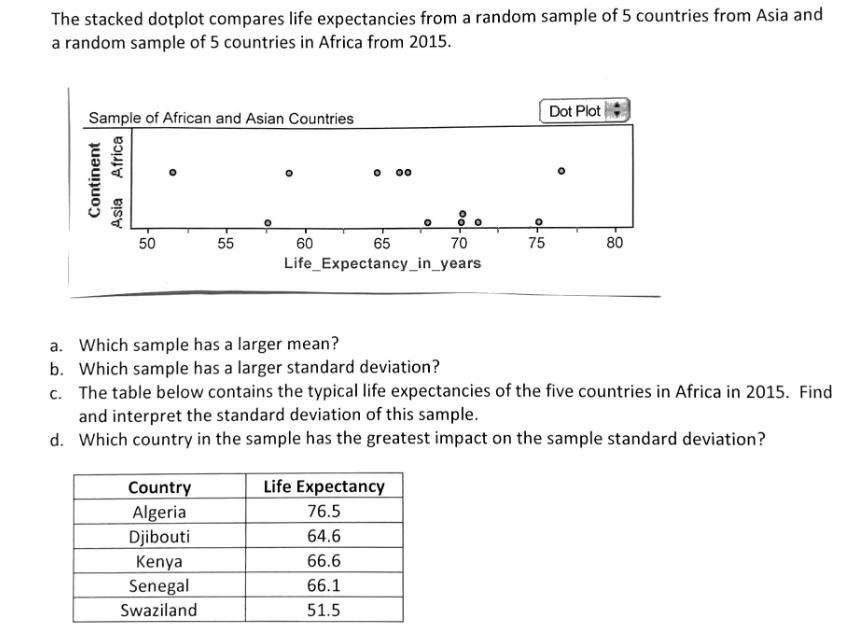
The stacked dotplot compares life expectancies from a random sample of 5 countries from Asia and a random sample of 5 countries in Africa from 2015. Sample of African and Asian Countries Africa Continent Asia 50 55 Country Algeria Djibouti Kenya Senegal Swaziland O 00 60 65 Life Expectancy_in_years 70 Life Expectancy 76.5 64.6 66.6 66.1 51.5 75 Dot Plot a. Which sample has a larger mean? b. Which sample has a larger standard deviation? c. The table below contains the typical life expectancies of the five countries in Africa in 2015. Find and interpret the standard deviation of this sample. d. Which country in the sample has the greatest impact on the sample standard deviation? 80
Step by Step Solution
There are 3 Steps involved in it
a Asia has a larger mean than Africa because from the stacked dot plot we can see that Asia countrie... View full answer

Get step-by-step solutions from verified subject matter experts