

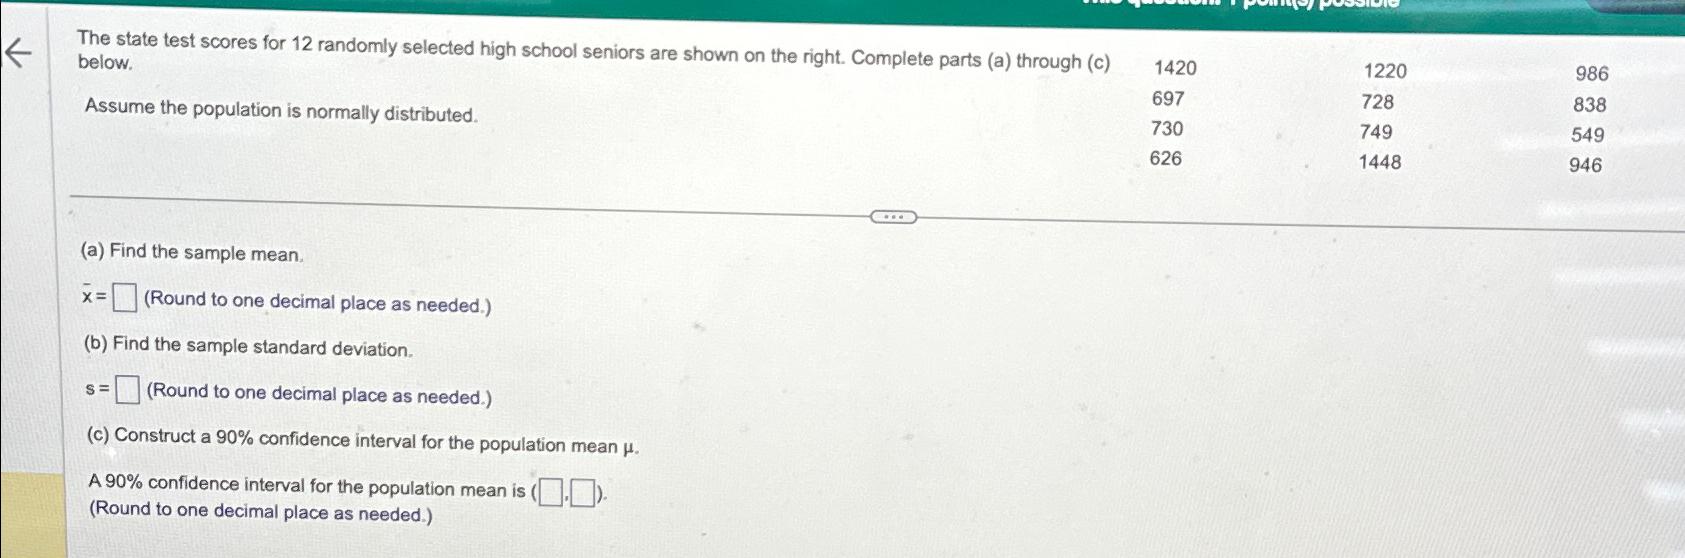
Question: The state test scores for 1 2 randomly selected high school seniors are shown on the right. Complete parts ( a ) through ( c
The state test scores for randomly selected high school seniors are shown on the right. Complete parts a through c below.
Assume the population is normally distributed.
a Find the sample mean.
Round to one decimal place as needed.
b Find the sample standard deviation.
Round to one decimal place as needed.
c Construct a confidence interval for the population mean
A confidence interval for the population mean is
Round to one decimal place as needed.
Step by Step Solution
There are 3 Steps involved in it
1 Expert Approved Answer
Step: 1 Unlock

Question Has Been Solved by an Expert!
Get step-by-step solutions from verified subject matter experts
Step: 2 Unlock
Step: 3 Unlock