

Question: The Statistical DecisionFourth, using the information you now have use the following outline to identify the most appropriate statistical technique.1. For a hypothesis of difference,a.
The Statistical DecisionFourth, using the information you now have use the following outline to identify the most appropriate statistical technique.1. For a hypothesis of difference,a. If the independent and dependent variables are both measured at the nominal level of measurement, use a Chi-Square model.b. If the independent variable is measured at the nominal level of measurement and the dependent variable is measured at the scale level of measurement,i. Use a t-test model when there are two groups to compare, orii. Use an Analysis of Variance (F-ratio) model if there are more than two groups to compare.2. For a hypothesis of association,a. If the independent and dependent variables are both measured at the scale level of measurement, use a Pearson R model.b. If the independent and dependent variables are both measured at the scale level of measurement and you want to use the independent variables to predict the value of the dependent variable, use a Regression model.
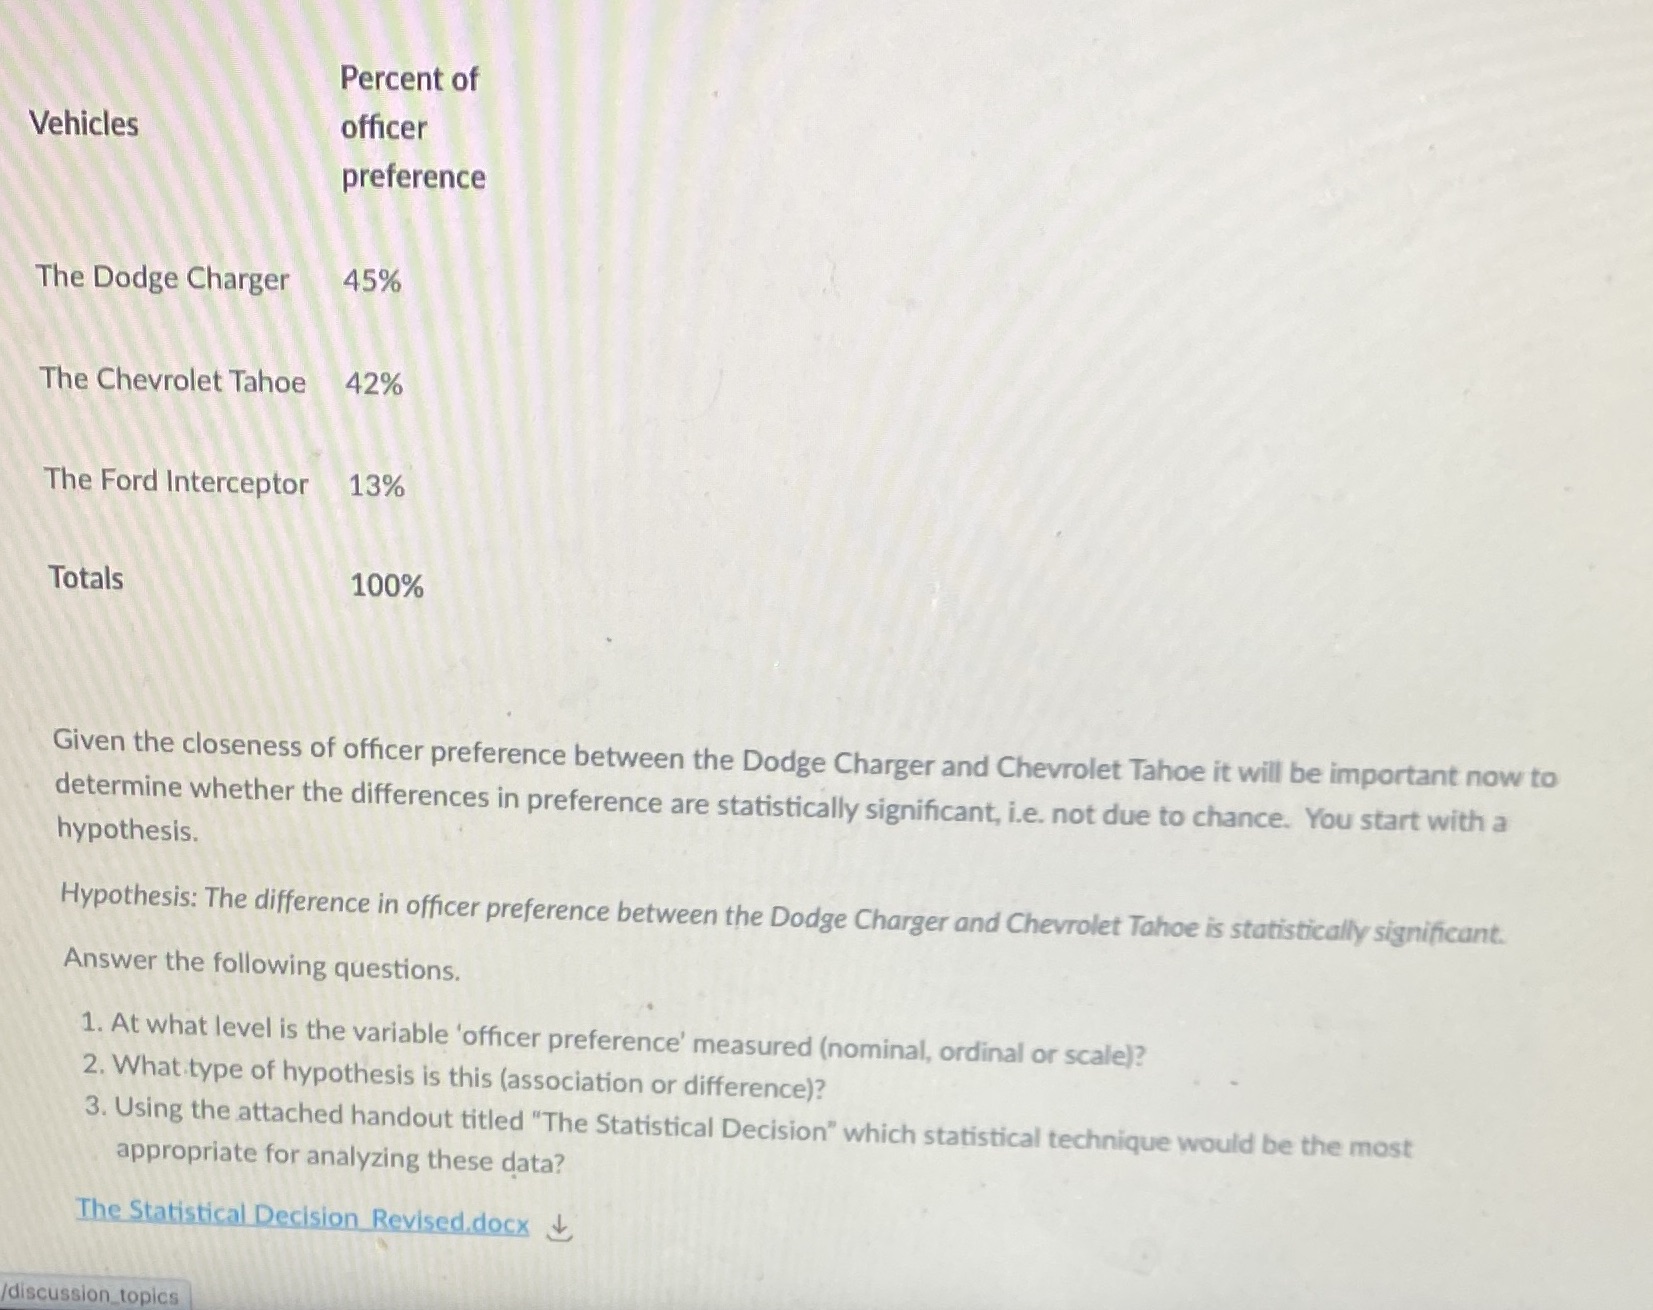
Percent of Vehicles officer preference The Dodge Charger 45% The Chevrolet Tahoe 42% The Ford Interceptor 13% Totals 100% Given the closeness of officer preference between the Dodge Charger and Chevrolet Tahoe it will be important now to determine whether the differences in preference are statistically significant, i.e. not due to chance. You start with a hypothesis. Hypothesis: The difference in officer preference between the Dodge Charger and Chevrolet Tahoe is statistically significant. Answer the following questions. 1. At what level is the variable 'officer preference' measured (nominal, ordinal or scale)? 2. What type of hypothesis is this (association or difference)? 3. Using the attached handout titled "The Statistical Decision" which statistical technique would be the most appropriate for analyzing these data? The Statistical Decision Revised. docx + discussion_topics
Step by Step Solution
There are 3 Steps involved in it

Get step-by-step solutions from verified subject matter experts