

Question: The summarized data follow a. Seiect the graph that correctly shows the yeid curve associated with the data shown in the table. b. Describe the
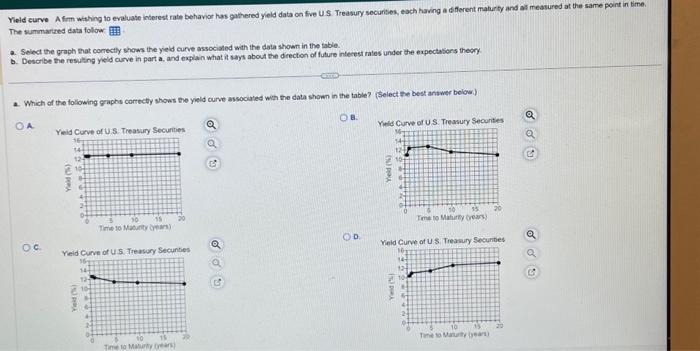
The summarized data follow a. Seiect the graph that correctly shows the yeid curve associated with the data shown in the table. b. Describe the resulting yeld curve in part a, and explain what it says about the direction of future intecest rates under the expectasons theory a. Which of the following graphs correcty shows the yield curve associated whthe data shown in the table? (Select the best ariswer belowi) The summarized data follow a. Seiect the graph that correctly shows the yeid curve associated with the data shown in the table. b. Describe the resulting yeld curve in part a, and explain what it says about the direction of future intecest rates under the expectasons theory a. Which of the following graphs correcty shows the yield curve associated whthe data shown in the table? (Select the best ariswer belowi)
Step by Step Solution
There are 3 Steps involved in it

Get step-by-step solutions from verified subject matter experts