

Question: The Table 1 below reports the autocorrelation function (ACF) and partial autocorrelation function (PACF) for the nominal returns of S&P500 (the first difference of the
The Table 1 below reports the autocorrelation function (ACF) and partial autocorrelation function (PACF) for the nominal returns of S&P500 (the first difference of the log S&P500 index) using monthly data for the period 1970-2018. In the Table 1 below k represents the number of lags and SE stands for the standard error. Identify the model that you should utilize in your analysis by examining Table 1 below. Explain in detail your answer.
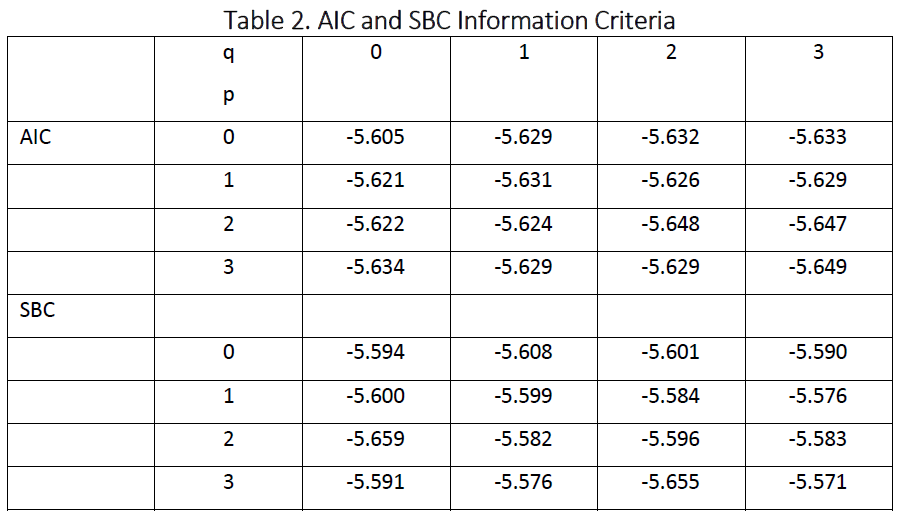
Table 2. AIC and SBC Information Criteria q 0 1 2 3 p AIC 0 -5.605 -5.629 -5.632 -5.633 1 -5.621 -5.631 -5.626 -5.629 2 -5.622 -5.624 -5.648 -5.647 3 3 -5.634 -5.629 -5.629 -5.649 SBC 0 -5.594 -5.608 -5.601 -5.590 1 -5.600 -5.599 -5.584 -5.576 2 -5.659 -5.582 -5.596 -5.583 3 3 -5.591 -5.576 -5.655 -5.571 Table 2. AIC and SBC Information Criteria q 0 1 2 3 p AIC 0 -5.605 -5.629 -5.632 -5.633 1 -5.621 -5.631 -5.626 -5.629 2 -5.622 -5.624 -5.648 -5.647 3 3 -5.634 -5.629 -5.629 -5.649 SBC 0 -5.594 -5.608 -5.601 -5.590 1 -5.600 -5.599 -5.584 -5.576 2 -5.659 -5.582 -5.596 -5.583 3 3 -5.591 -5.576 -5.655 -5.571
Step by Step Solution
There are 3 Steps involved in it

Get step-by-step solutions from verified subject matter experts