

Question: The table and graph below show the results from the Push-Pull game. In which round could most equilibrium choices and outcomes be observed? Group of
The table and graph below show the results from the "Push-Pull" game.
In which round could most equilibrium choices and outcomes be observed?
Group of answer choices
a) Round 1
b) Round 2
c) Round 3
d) Round 4
e) Round 5
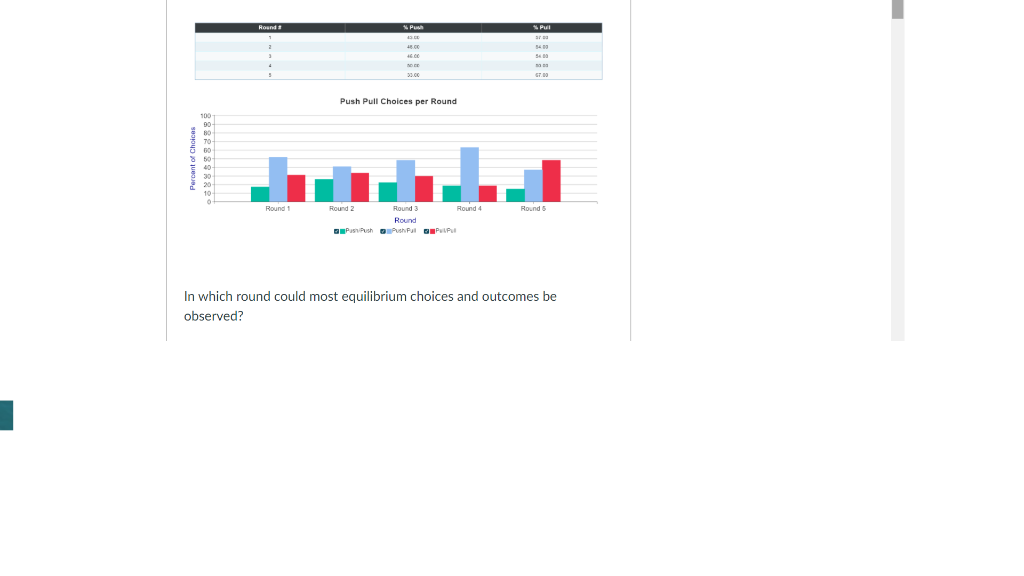
Pull 1 ST.NO Push Pull Choices per Round Percent of Choices Round 1 Round 2 Round 3 Round 4 Round S Round In which round could most equilibrium choices and outcomes be observed
Step by Step Solution
There are 3 Steps involved in it
1 Expert Approved Answer
Step: 1 Unlock

Question Has Been Solved by an Expert!
Get step-by-step solutions from verified subject matter experts
Step: 2 Unlock
Step: 3 Unlock