

Question: The table and the graph below show information about the number of students in an education center in each term in years 2018 to 2020.
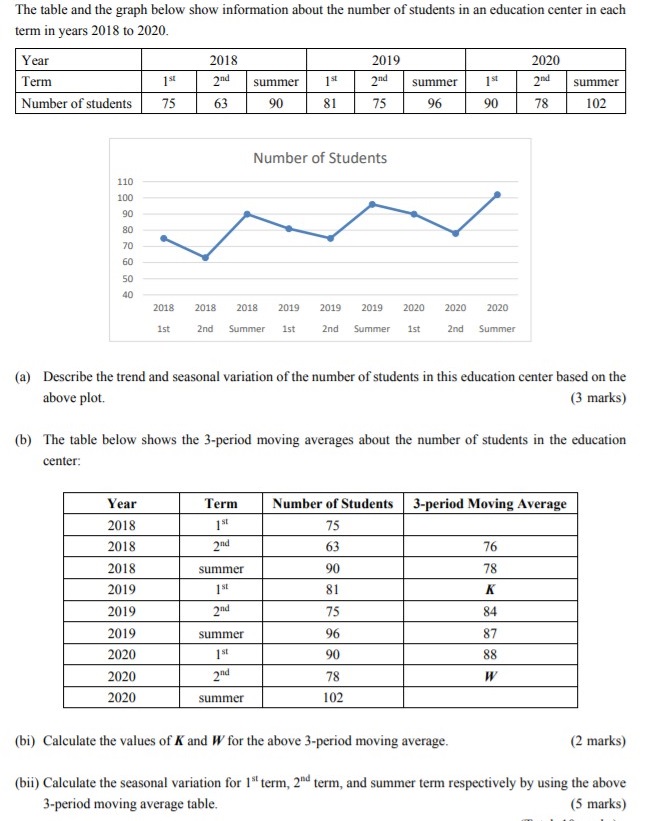
The table and the graph below show information about the number of students in an education center in each term in years 2018 to 2020. Year 2018 2019 2020 Term 1 st and summer 1 st and summer 1 St summer Number of students 75 63 90 81 75 96 90 78 102 Number of Students 110 100 90 80 70 60 50 40 2018 2018 2018 2019 2019 2019 2020 2020 2020 1st 2nd Summer 1st 2nd Summer 1st 2nd Summer (a) Describe the trend and seasonal variation of the number of students in this education center based on the above plot. (3 marks) (b) The table below shows the 3-period moving averages about the number of students in the education center: Year Term Number of Students 3-period Moving Average 2018 75 2018 and 63 76 2018 summer 90 78 2019 81 K 2019 and 75 84 2019 summer 96 87 2020 St 90 88 2020 78 W 2020 summer 102 (bi) Calculate the values of K and W for the above 3-period moving average. (2 marks) (bii) Calculate the seasonal variation for 1" term, 2" term, and summer term respectively by using the above 3-period moving average table
Step by Step Solution
There are 3 Steps involved in it

Get step-by-step solutions from verified subject matter experts