

Question: The table available below contains data on a nation's total box office grosses ($billion), total number of admissions (billion), average ticket price ($), and number
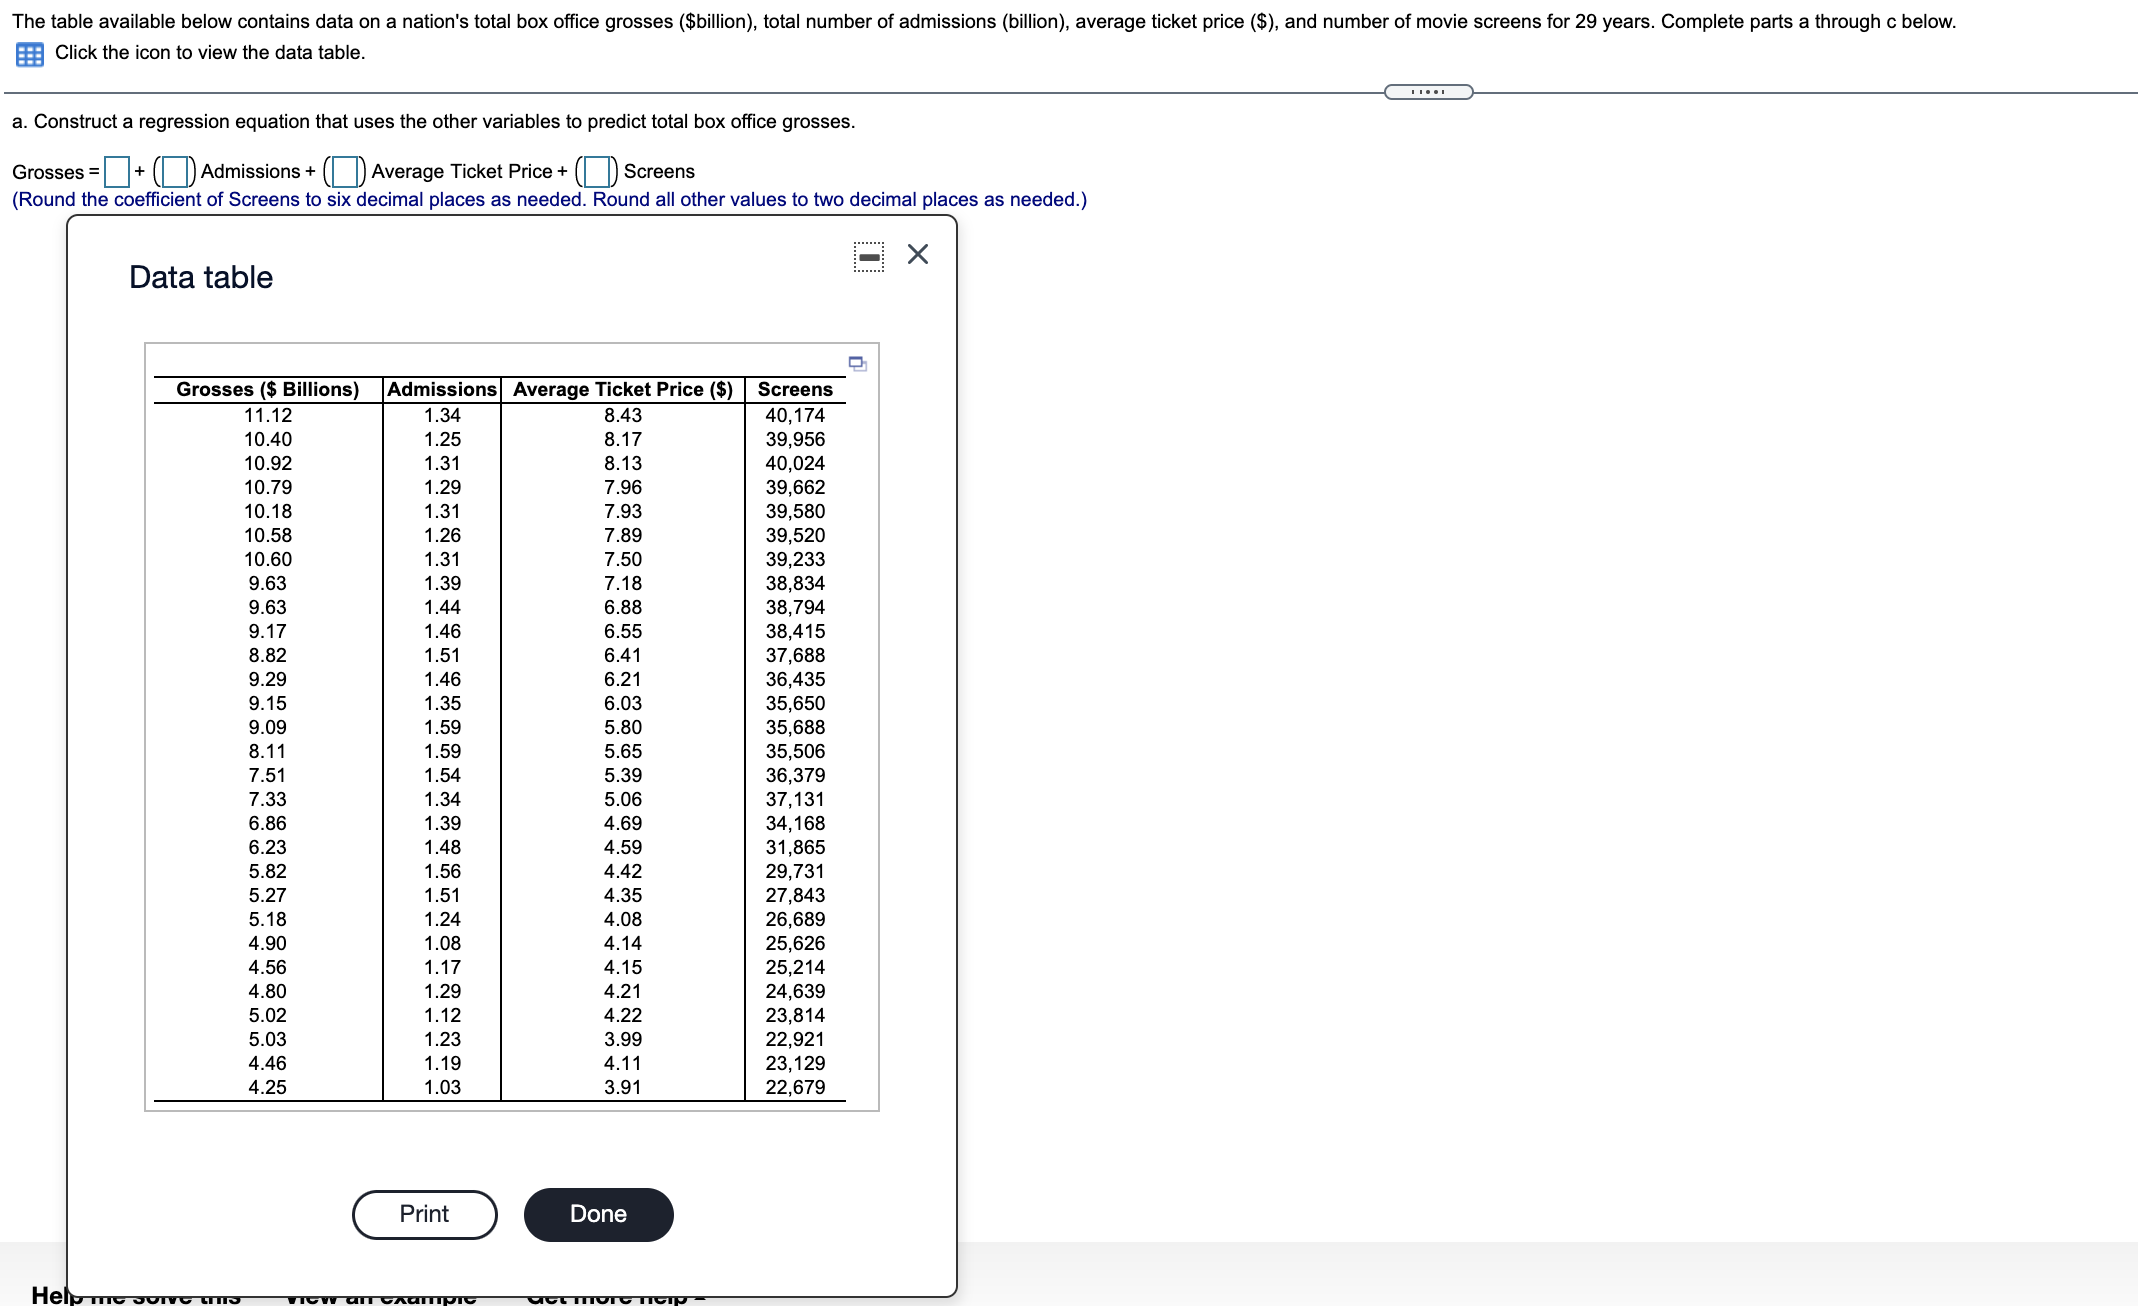
The table available below contains data on a nation's total box office grosses ($billion), total number of admissions (billion), average ticket price ($), and number of movie screens for 29 years. Complete parts a through c below. Click the icon to view the data table. a. Construct a regression equation that uses the other variables to predict total box office grosses. Grosses =+ Admissions + ()Average Ticket Price + (Screens (Round the coefficient of Screens to six decimal places as needed. Round all other values to two decimal places as needed.) X Data table Grosses ($ Billions) Admissions Average Ticket Price ($) | Screens 11.12 1.34 8.43 40, 174 10.40 1.25 8.17 39,956 10.92 1.31 8.13 40,024 10.79 1.29 7.96 39,662 10.18 1.31 7.93 39,580 10.58 1.26 7.89 39,520 10.60 1.31 7.50 39,233 9.63 1.39 7.18 38,834 9.63 1.44 6.88 38,794 9.17 1.46 6.55 38,415 8.82 1.51 6.41 37,688 9.29 1.46 6.21 36,435 9.15 1.35 6.03 35,650 9.09 1.59 5.80 35,688 8.11 1.59 5.65 35,506 7.51 1.54 5.39 36,379 7.33 1.34 5.06 37,131 6.86 1.39 4.69 34, 168 6.23 1.48 4.59 31,865 5.82 1.56 4.42 29,731 5.27 1.51 4.35 27,843 5.18 1.24 4.08 26,689 4.90 1.08 4.14 25,626 4.56 1.17 4.15 25,214 4.80 1.29 4.21 24,639 5.02 1.12 4.22 23,814 5.03 1.23 3.99 22,921 4.46 1.19 4.11 23, 129 4.25 1.03 3.91 22,679 Print Done Hel
Step by Step Solution
There are 3 Steps involved in it

Get step-by-step solutions from verified subject matter experts