

Question: The table below contains 2019 data on the monthly amount in millions of dollars which was spent for advertising apparel and accessories in a leading
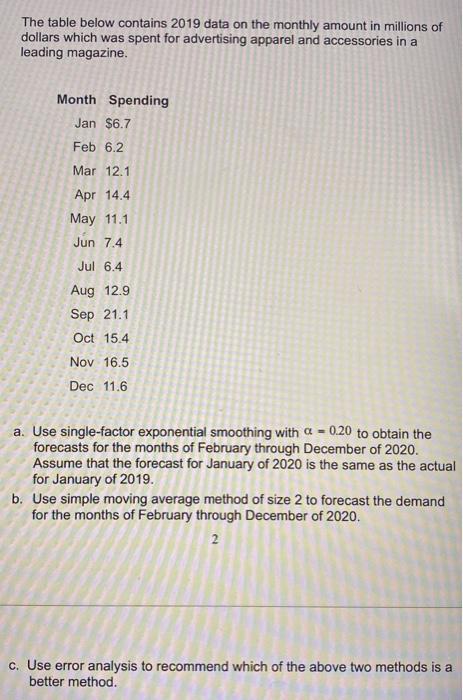
The table below contains 2019 data on the monthly amount in millions of dollars which was spent for advertising apparel and accessories in a leading magazine. a. Use single-factor exponential smoothing with =0.20 to obtain the forecasts for the months of February through December of 2020. Assume that the forecast for January of 2020 is the same as the actual for January of 2019. b. Use simple moving average method of size 2 to forecast the demand for the months of February through December of 2020. 2 c. Use error analysis to recommend which of the above two methods is a better method
Step by Step Solution
There are 3 Steps involved in it
1 Expert Approved Answer
Step: 1 Unlock

Question Has Been Solved by an Expert!
Get step-by-step solutions from verified subject matter experts
Step: 2 Unlock
Step: 3 Unlock